

Python and the Weather
This project focuses on collecting and visualizing historical weather data to uncover trends and patterns over time. By leveraging data from reliable sources such as NOAA, Visual Crossing and others, I aim to provide comprehensive insights into weather changes across different regions. The collected data includes various weather parameters like temperature, precipitation, and wind speed, which are crucial for understanding climate dynamics.
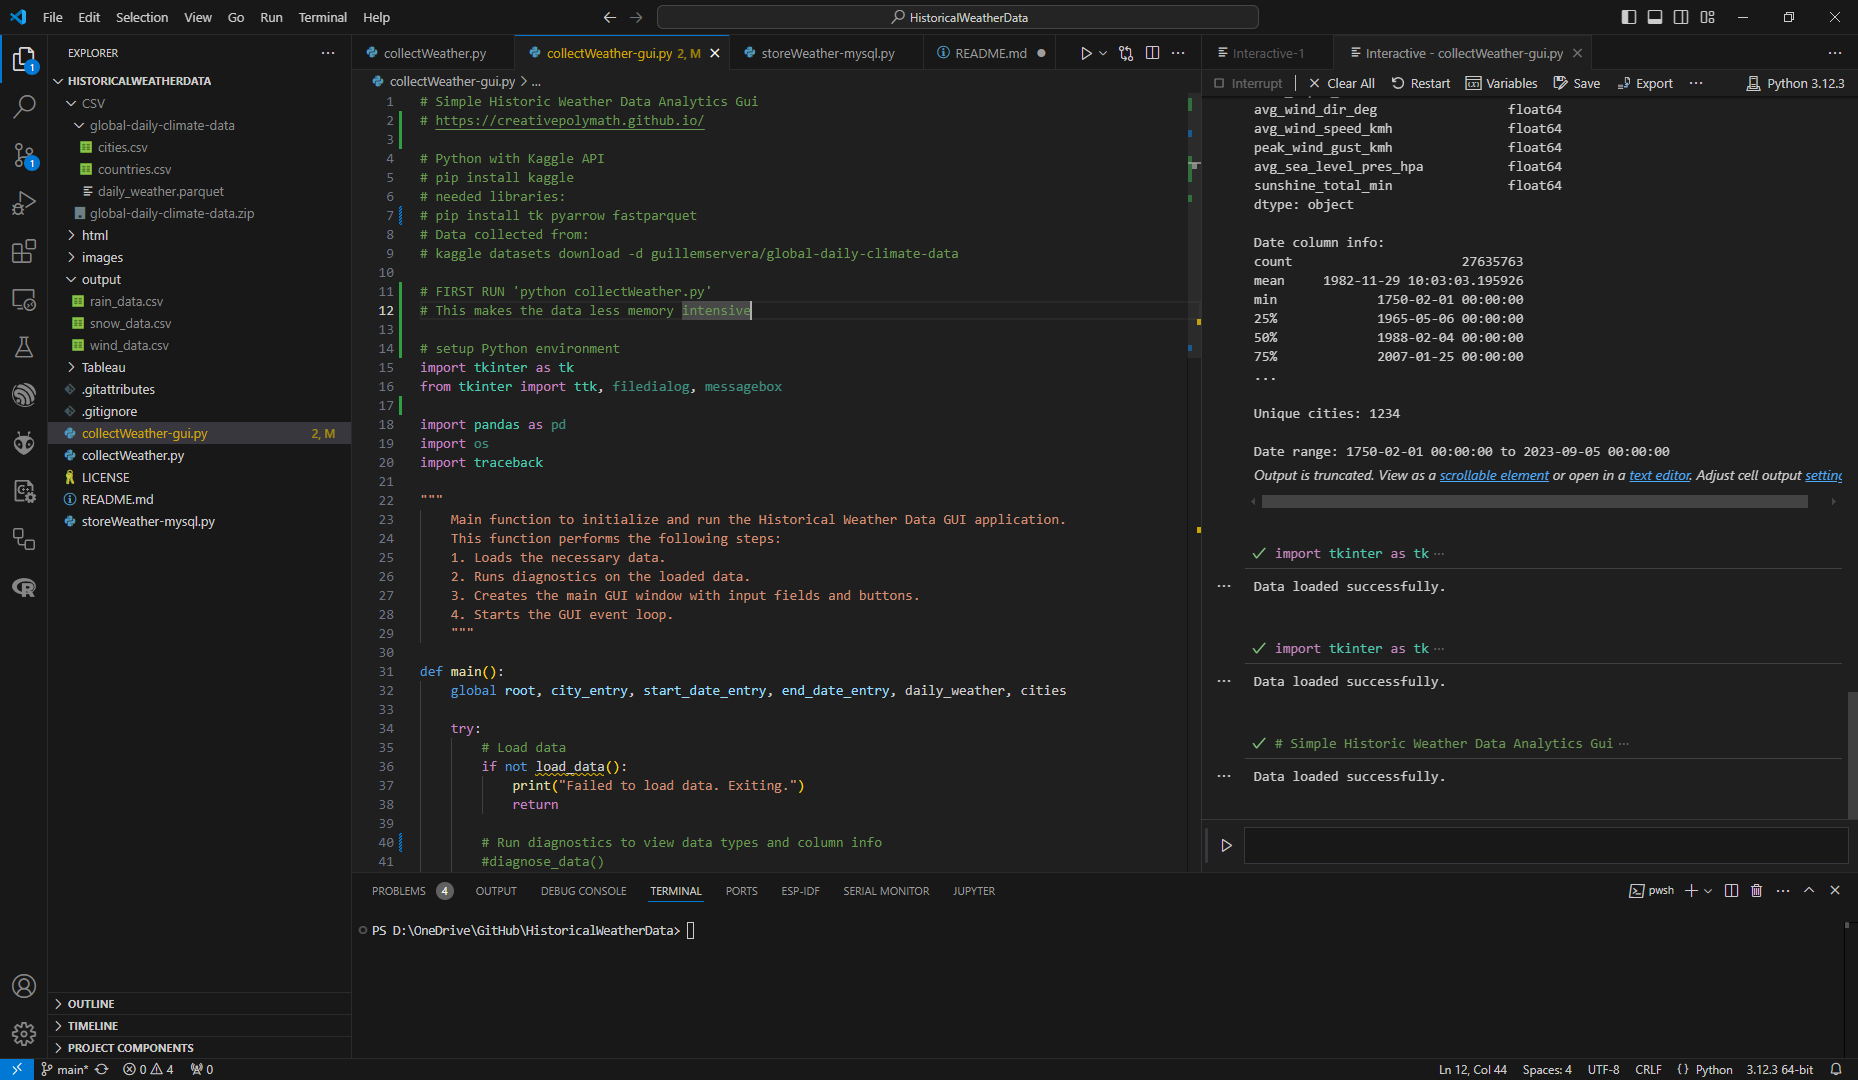
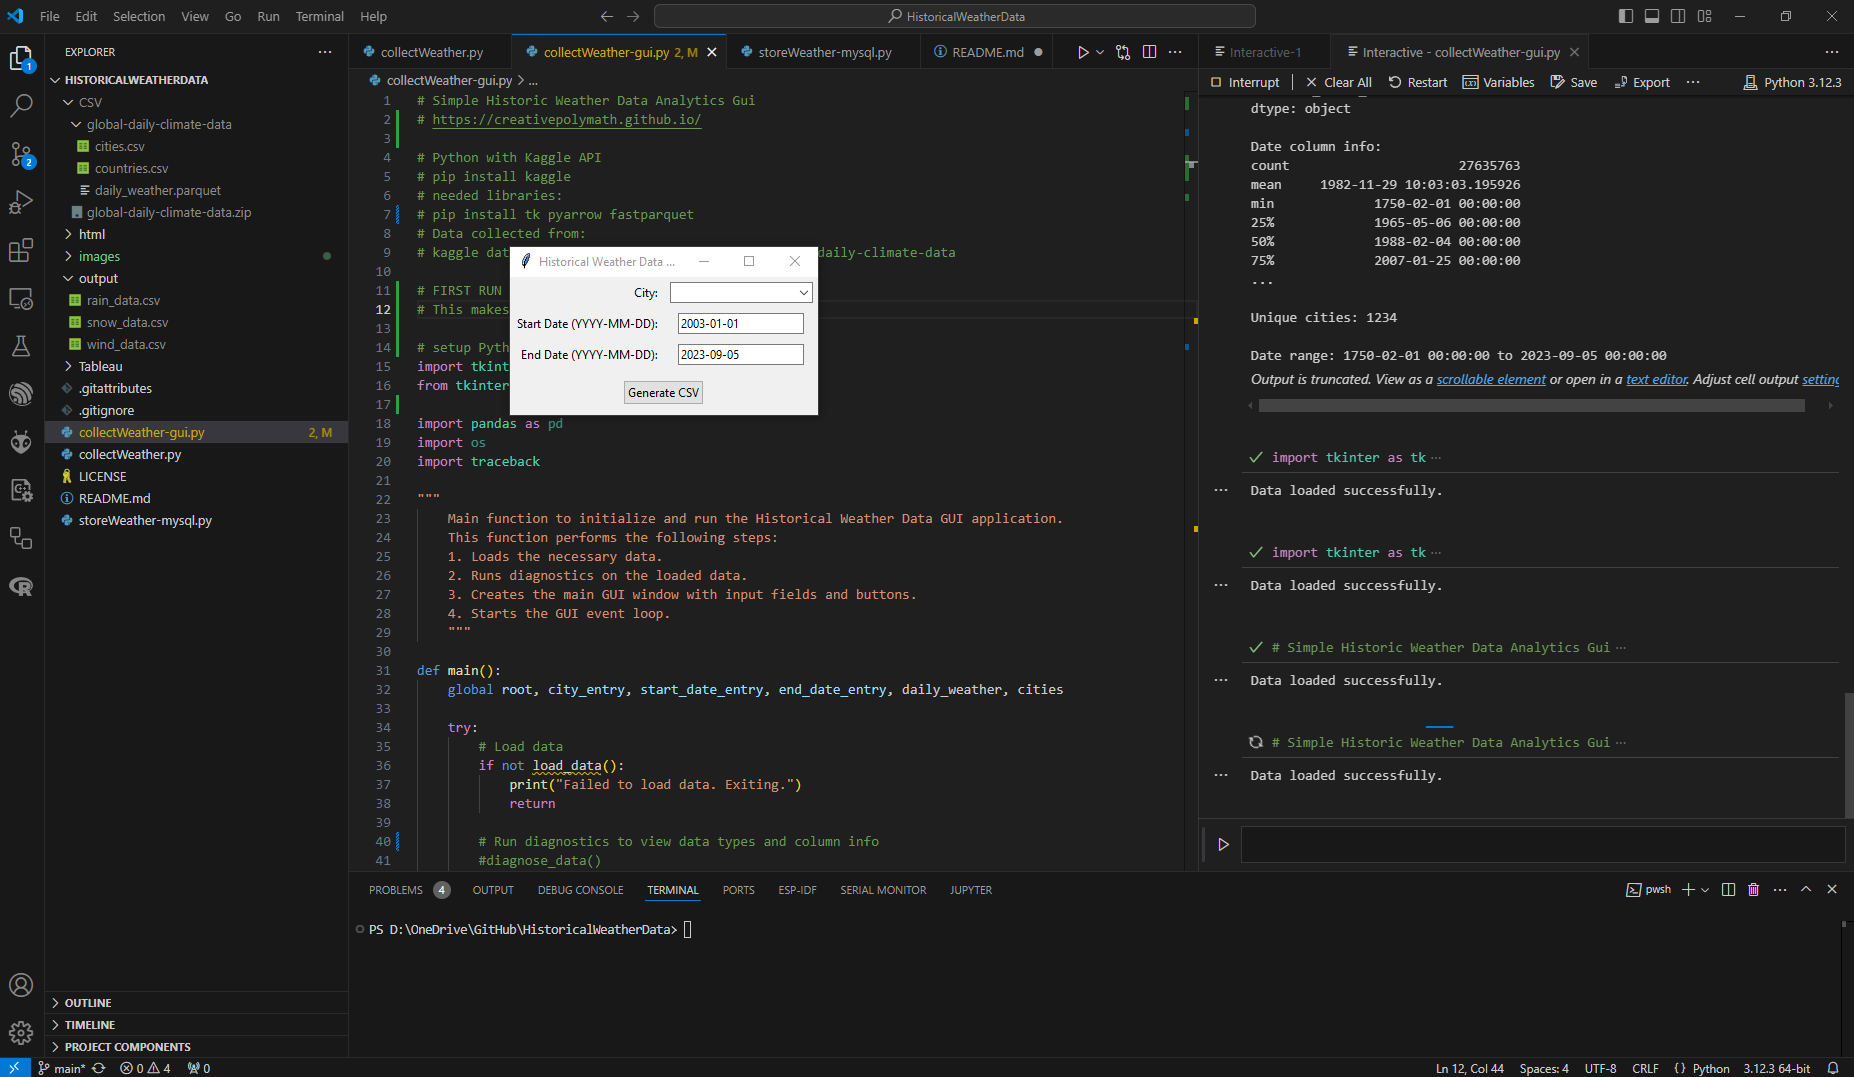
For now, the application is in 2 parts to keep the memory usage low. Initially, it was maxing out 64gb. While I’m learning, this application only runs from the VSCode interactive terminal and you must run ‘collectWeather.py’ before launching the gui.
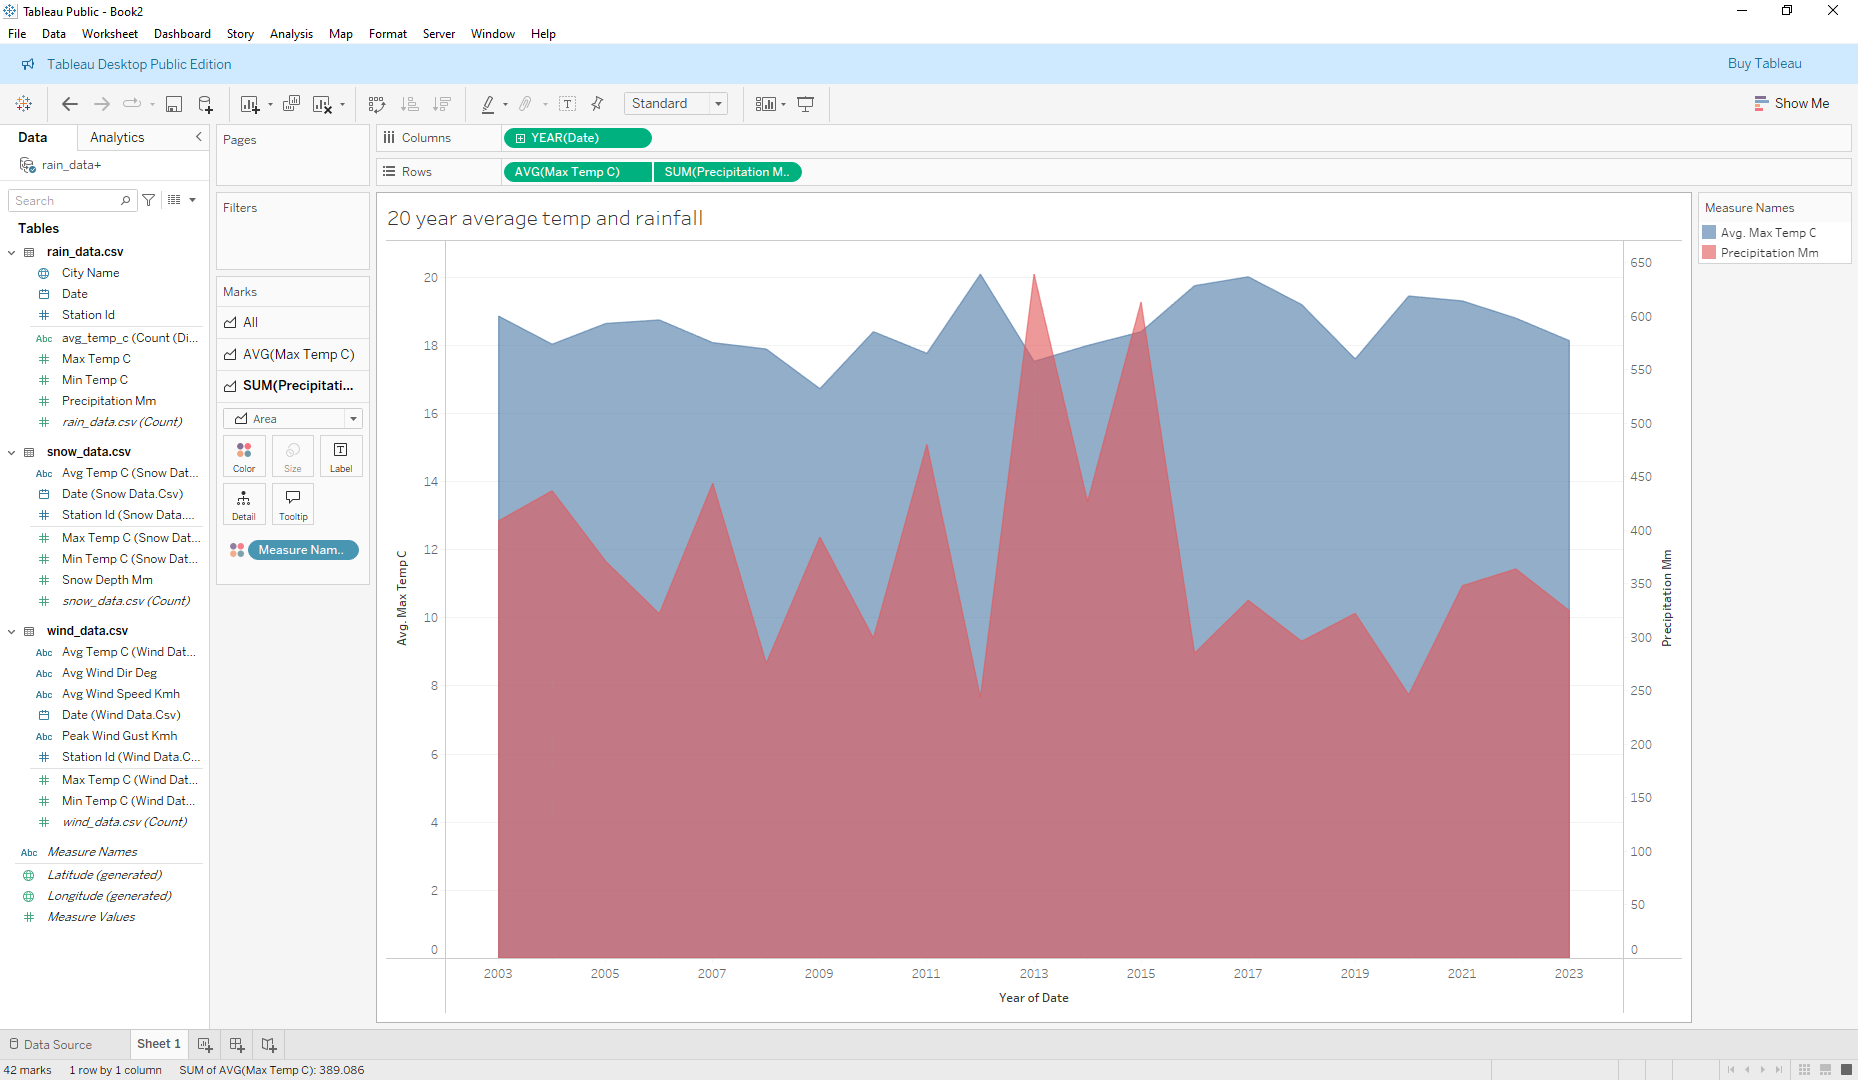
The visualization aspect of this project is designed to make the data more accessible and understandable. Using tools like Python and Tableau, I’m creating interactive dashboards and graphs that allow users to explore the data in a user-friendly manner. These visualizations help in identifying significant weather events, seasonal variations, and long-term climate trends, making the information valuable for researchers, educators, and weather enthusiasts.
The full project is on Github