<?xml version="1.0" encoding="utf-8"?><feed xmlns="http://www.w3.org/2005/Atom" ><generator uri="https://jekyllrb.com/" version="3.10.0">Jekyll</generator><link href="https://creativepolymath.github.io/feed.xml" rel="self" type="application/atom+xml" /><link href="https://creativepolymath.github.io/" rel="alternate" type="text/html" /><updated>2026-04-18T10:51:44-04:00</updated><id>https://creativepolymath.github.io/feed.xml</id><title type="html">Polymathic Projects</title><subtitle>Welcome to my GitHub portfolio, showcasing my journey as an entry-level data analyst passionate about weather, cycling, and gardening data. Explore my resume and diverse data science projects, featuring advanced visualizations created using R and Python. Discover how I leverage data to uncover insights and trends, and see my latest work in graphic design and 3D modeling. Dive into my articles on Medium to learn more about my data analytics journey and how I continuously expand my skills. Connect with me to collaborate on innovative data-driven projects!</subtitle><author><name>Gregory Whitmore</name></author><entry><title type="html">Parametric City Generator - Blender</title><link href="https://creativepolymath.github.io/blog/parametric-city/" rel="alternate" type="text/html" title="Parametric City Generator - Blender" /><published>2026-03-22T16:30:30-04:00</published><updated>2026-03-22T16:30:30-04:00</updated><id>https://creativepolymath.github.io/blog/parametric-city</id><content type="html" xml:base="https://creativepolymath.github.io/blog/parametric-city/"><![CDATA[<h2 id="overview">Overview</h2>
<p>This project focuses on automating the repetitive aspects of city creation in Blender by building a parametric terrain generator. Instead of manually placing geometry, the system allows users to generate a fully populated city using adjustable parameters while maintaining an organic feel.</p>

<h2 id="-objective">🎯 Objective</h2>
<p>Eliminate manual, repetitive modeling tasks by creating a procedural system that:</p>
<ul>
  <li>Rapidly generates city layouts</li>
  <li>Maintains visual variation and realism</li>
  <li>Allows quick iteration for creative workflows</li>
</ul>

<h2 id="-tools--technologies">🛠 Tools &amp; Technologies</h2>
<ul>
  <li>Blender (Python API)</li>
  <li>Procedural modeling techniques</li>
  <li>Parametric design logic</li>
</ul>

<h2 id="️-process">⚙️ Process</h2>

<h3 id="1-core-system-design">1. Core System Design</h3>
<ul>
  <li>Developed a script-based generator using Blender’s Python API</li>
  <li>Focused on parameter-driven control instead of manual placement</li>
  <li>Ensured all geometry aligns to a consistent ground plane</li>
</ul>

<h3 id="2-parameter-development">2. Parameter Development</h3>
<p>Implemented adjustable controls for:</p>
<ul>
  <li>Building density</li>
  <li>Height randomization</li>
  <li>X/Y scale variation</li>
  <li>Spacing randomness (for tighter or more open layouts)</li>
</ul>

<h3 id="3-structural-logic">3. Structural Logic</h3>
<ul>
  <li>Ensured all buildings are ground-aligned</li>
  <li>Introduced controlled randomness to avoid repetitive patterns</li>
  <li>Balanced variation with stability for predictable outputs</li>
</ul>

<h3 id="4-visual-variation">4. Visual Variation</h3>
<ul>
  <li>Added randomized roof generation</li>
  <li>Created flat terrain base for clean scene integration</li>
  <li>Tuned parameters to produce believable city clusters</li>
</ul>

<h2 id="-challenges--solutions">🚧 Challenges &amp; Solutions</h2>

<p><strong>Challenge:</strong> Avoiding repetitive, artificial-looking layouts<br />
<strong>Solution:</strong> Introduced layered randomness (scale, spacing, height) while maintaining constraints</p>

<p><strong>Challenge:</strong> Ensuring all buildings properly align with terrain<br />
<strong>Solution:</strong> Forced Z-axis base alignment across all generated geometry</p>

<p><strong>Challenge:</strong> Balancing control with randomness<br />
<strong>Solution:</strong> Designed parameter ranges that allow flexibility without breaking composition</p>

<h2 id="-results--outcome">📊 Results / Outcome</h2>
<ul>
  <li>Fully procedural city generation system</li>
  <li>Rapid scene creation with minimal manual input</li>
  <li>Consistent, ground-aligned geometry ready for rendering or export</li>
  <li>Flexible tool usable across multiple creative workflows</li>
</ul>

<h2 id="-improvements--next-steps">🔄 Improvements / Next Steps</h2>
<ul>
  <li>Road and street generation system</li>
  <li>District zoning (e.g., downtown vs residential)</li>
  <li>Material and texture variation</li>
  <li>Window pattern generator</li>
  <li>Block-based grid and layout controls</li>
</ul>

<h2 id="-use-cases">🧩 Use Cases</h2>
<ul>
  <li>Background environments</li>
  <li>Game prototyping</li>
  <li>Motion graphics</li>
  <li>Kitbashing starting points</li>
  <li>Concept art layouts</li>
</ul>

<h2 id="-takeaways">💭 Takeaways</h2>
<p>Automating repetitive modeling tasks allows more time for composition and storytelling.</p>

<p>This project highlights how parametric design can:</p>
<ul>
  <li>Speed up production workflows</li>
  <li>Improve consistency</li>
  <li>Enable rapid iteration in creative environments</li>
</ul>

<p>Procedural tools like this bridge the gap between technical development and artistic control.</p>]]></content><author><name>Gregory Whitmore</name></author><category term="blog" /><category term="coding" /><category term="python" /><category term="Blender" /><category term="parametric" /><summary type="html"><![CDATA[Overview This project focuses on automating the repetitive aspects of city creation in Blender by building a parametric terrain generator. Instead of manually placing geometry, the system allows users to generate a fully populated city using adjustable parameters while maintaining an organic feel.]]></summary></entry><entry><title type="html">Vibe Coding and LEAN Manufacturing</title><link href="https://creativepolymath.github.io/blog/vibecoding-lean/" rel="alternate" type="text/html" title="Vibe Coding and LEAN Manufacturing" /><published>2025-11-16T15:30:30-05:00</published><updated>2025-11-16T15:30:30-05:00</updated><id>https://creativepolymath.github.io/blog/vibecoding-lean</id><content type="html" xml:base="https://creativepolymath.github.io/blog/vibecoding-lean/"><![CDATA[<h2 id="overview">Overview</h2>
<p>This project began as a simple RFID test and evolved into a lightweight machine usage tracking system designed for LEAN manufacturing environments. The goal was to create a no-frills tool that captures real machine runtime data without adding complexity to the shop floor.</p>

<h2 id="-objective">🎯 Objective</h2>
<p>Develop a simple, reliable system to:</p>
<ul>
  <li>Track machine start and stop events</li>
  <li>Record accurate runtime durations</li>
  <li>Provide clear, real-time feedback to operators</li>
  <li>Support LEAN principles by exposing inefficiencies</li>
</ul>

<h2 id="-tools--technologies">🛠 Tools &amp; Technologies</h2>
<ul>
  <li>ESP32 microcontroller</li>
  <li>MFRC522 RFID reader</li>
  <li>ST7789 TFT display</li>
  <li>MQTT (for data transmission)</li>
  <li>NTP (for timestamp synchronization)</li>
  <li>Arduino IDE / C++</li>
  <li>Python (for data logging and CSV generation)</li>
</ul>

<h2 id="️-process">⚙️ Process</h2>

<h3 id="1-initial-concept">1. Initial Concept</h3>
<p>The project started as a basic RFID reader test to detect user input and trigger events.</p>

<h3 id="2-workflow-expansion">2. Workflow Expansion</h3>
<p>Functionality was expanded to include:</p>
<ul>
  <li>Machine start/stop logging via RFID scans</li>
  <li>Timestamp recording using NTP</li>
  <li>Prevention of conflicting inputs during active jobs</li>
</ul>

<h3 id="3-real-time-feedback">3. Real-Time Feedback</h3>
<ul>
  <li>Integrated a TFT display to show:
    <ul>
      <li>Active job status</li>
      <li>Start time</li>
      <li>Elapsed runtime counter</li>
    </ul>
  </li>
  <li>Designed the interface for quick readability on the shop floor</li>
</ul>

<h3 id="4-data-transmission">4. Data Transmission</h3>
<ul>
  <li>Implemented MQTT to send scan and timing data</li>
  <li>Developed a Python-based receiver to log data into structured CSV files</li>
</ul>

<h3 id="5-iteration--refinement">5. Iteration &amp; Refinement</h3>
<ul>
  <li>Adjusted logic to ensure accurate runtime tracking</li>
  <li>Improved display clarity and usability</li>
  <li>Debugged SPI conflicts between RFID reader and display</li>
</ul>

<h2 id="-challenges--solutions">🚧 Challenges &amp; Solutions</h2>

<p><strong>Challenge:</strong> Managing multiple SPI devices (RFID + display)<br />
<strong>Solution:</strong> Configured shared SPI bus with proper chip select handling and timing adjustments</p>

<p><strong>Challenge:</strong> Ensuring accurate and consistent timestamps<br />
<strong>Solution:</strong> Integrated NTP synchronization to standardize time across sessions</p>

<p><strong>Challenge:</strong> Preventing incorrect or duplicate scans during operation<br />
<strong>Solution:</strong> Implemented logic to lock input to the active RFID tag until the job is completed</p>

<p><strong>Challenge:</strong> Keeping the interface usable in a fast-paced environment<br />
<strong>Solution:</strong> Focused on minimal, high-contrast display output with only essential information</p>

<h2 id="-results--outcome">📊 Results / Outcome</h2>
<ul>
  <li>Functional machine tracking system with start/stop logging</li>
  <li>Real-time runtime display visible to operators</li>
  <li>Automated data logging for later analysis</li>
  <li>Reduced ambiguity in machine usage tracking</li>
</ul>

<h2 id="-improvements--next-steps">🔄 Improvements / Next Steps</h2>
<ul>
  <li>Add multi-machine support</li>
  <li>Develop a web dashboard for data visualization</li>
  <li>Integrate downtime categorization (planned vs unplanned)</li>
  <li>Expand analytics for OEE (Overall Equipment Effectiveness)</li>
</ul>

<h2 id="-visuals">📸 Visuals</h2>
<p><img src="images/rfid-machine-tracker.jpg" alt="RFID Setup" />
<img src="images/runtime-display.jpg" alt="Display Output" /></p>

<h2 id="-takeaways">💭 Takeaways</h2>
<p>LEAN manufacturing is not about adding more systems—it is about removing friction and making the important data visible.</p>

<p>This project reinforced the value of building tools that are:</p>
<ul>
  <li>Simple to use</li>
  <li>Focused on real problems</li>
  <li>Designed for the people actually doing the work</li>
</ul>

<p>Even a small, well-targeted system can create meaningful visibility into process inefficiencies.</p>]]></content><author><name>Gregory Whitmore</name></author><category term="blog" /><category term="coding" /><category term="ai" /><category term="python" /><category term="rfid" /><summary type="html"><![CDATA[Overview This project began as a simple RFID test and evolved into a lightweight machine usage tracking system designed for LEAN manufacturing environments. The goal was to create a no-frills tool that captures real machine runtime data without adding complexity to the shop floor.]]></summary></entry><entry><title type="html">Powering Up the AetherBeam — Custom 1S2P Li-Ion Packs!</title><link href="https://creativepolymath.github.io/blog/powering-up/" rel="alternate" type="text/html" title="Powering Up the AetherBeam — Custom 1S2P Li-Ion Packs!" /><published>2025-05-17T16:30:30-04:00</published><updated>2025-05-17T16:30:30-04:00</updated><id>https://creativepolymath.github.io/blog/powering-up</id><content type="html" xml:base="https://creativepolymath.github.io/blog/powering-up/"><![CDATA[<h2 id="-overview">🧠 Overview</h2>
<p>This bench session focused on building custom 1S2P lithium-ion battery packs using a precision spot welding setup. While originally intended for a separate project, the configuration proved to be an excellent fit for the Aetherbeam LED system—delivering high capacity in a compact form factor.</p>

<h2 id="-objective">🎯 Objective</h2>
<p>Design and assemble a high-capacity, compact battery pack that:</p>
<ul>
  <li>Maximizes runtime for LED applications</li>
  <li>Maintains a clean, space-efficient layout</li>
  <li>Ensures safe and reliable operation</li>
</ul>

<h2 id="-tools--technologies">🛠 Tools &amp; Technologies</h2>
<ul>
  <li>FNRISI SWM-10 spot welder</li>
  <li>Samsung 35E 18650 lithium-ion cells (3500mAh each)</li>
  <li>Pure nickel strip (for conductivity and durability)</li>
  <li>XT-style balance leads</li>
  <li>3D-printed battery alignment jig</li>
  <li>Multimeter (for validation and testing)</li>
</ul>

<h2 id="️-process">⚙️ Process</h2>

<h3 id="1-pack-configuration">1. Pack Configuration</h3>
<p>A 1S2P configuration was selected:</p>
<ul>
  <li>1 series group (nominal 3.7V)</li>
  <li>2 cells in parallel for increased capacity</li>
</ul>

<p>This results in a combined capacity of approximately <strong>7000mAh</strong>, ideal for extended runtime applications.</p>

<h3 id="2-cell-preparation--alignment">2. Cell Preparation &amp; Alignment</h3>
<ul>
  <li>Cells were inspected and matched for consistency</li>
  <li>A custom 3D-printed jig was used to maintain alignment during assembly</li>
  <li>Layout was optimized for both compactness and structural stability</li>
</ul>

<h3 id="3-spot-welding-assembly">3. Spot Welding Assembly</h3>
<ul>
  <li>Nickel strips were spot welded to create solid electrical connections</li>
  <li>Heat exposure to cells was minimized compared to traditional soldering</li>
  <li>Weld consistency ensured reliable conductivity across the pack</li>
</ul>

<h3 id="4-lead-integration">4. Lead Integration</h3>
<ul>
  <li>XT-style leads were prepared and positioned for clean integration</li>
  <li>Connections were verified prior to final assembly</li>
</ul>

<h2 id="-challenges--solutions">🚧 Challenges &amp; Solutions</h2>

<p><strong>Challenge:</strong> Maintaining precise alignment during welding<br />
<strong>Solution:</strong> Designed and used a custom 3D-printed jig to hold cells securely in place</p>

<p><strong>Challenge:</strong> Avoiding heat damage to lithium-ion cells<br />
<strong>Solution:</strong> Used spot welding instead of direct soldering to reduce thermal stress</p>

<p><strong>Challenge:</strong> Balancing compact design with usability<br />
<strong>Solution:</strong> Optimized layout to fit within Aetherbeam constraints without sacrificing accessibility</p>

<h2 id="-results--outcome">📊 Results / Outcome</h2>
<ul>
  <li>Achieved ~7000mAh capacity using Samsung 35E cells</li>
  <li>Clean, compact battery pack suitable for integration into Aetherbeam</li>
  <li>Reliable weld quality and consistent electrical performance</li>
  <li>Improved projected runtime for LED applications</li>
</ul>

<h2 id="-improvements--next-steps">🔄 Improvements / Next Steps</h2>
<ul>
  <li>Integrate full BMS for enhanced protection</li>
  <li>Design a sealed enclosure for outdoor/weather resistance</li>
  <li>Explore modular battery swapping options</li>
  <li>Release STL files for the battery jig and enclosure</li>
</ul>

<h2 id="-visuals">📸 Visuals</h2>
<p><img src="images/aetherbeam-spot-welder.jpg" alt="Spot Welding Setup" />
<img src="images/aetherbeam-pack.jpg" alt="Battery Pack Assembly" /></p>

<h2 id="-takeaways">💭 Takeaways</h2>
<p>Building custom lithium-ion packs highlights the importance of precision, safety, and repeatability.<br />
Using proper tools like a spot welder and alignment jig significantly improves both build quality and reliability.</p>

<p>This project reinforces the value of designing systems holistically—where power, form factor, and usability all need to work together.</p>]]></content><author><name>Gregory Whitmore</name></author><category term="blog" /><category term="LiIon" /><category term="ai" /><category term="aetherbeam" /><summary type="html"><![CDATA[🧠 Overview This bench session focused on building custom 1S2P lithium-ion battery packs using a precision spot welding setup. While originally intended for a separate project, the configuration proved to be an excellent fit for the Aetherbeam LED system—delivering high capacity in a compact form factor.]]></summary></entry><entry><title type="html">Data Scraping with AI</title><link href="https://creativepolymath.github.io/blog/ai-web-scraping/" rel="alternate" type="text/html" title="Data Scraping with AI" /><published>2024-10-10T16:30:30-04:00</published><updated>2024-10-10T16:30:30-04:00</updated><id>https://creativepolymath.github.io/blog/ai-web-scraping</id><content type="html" xml:base="https://creativepolymath.github.io/blog/ai-web-scraping/"><![CDATA[<p>The <a href="https://github.com/creativepolymath/LOPSWebScraper">L.O.P.S. Web Scraper</a> is a practical tool that combines <a href="https://www.langchain.com/">Langchain</a>, <a href="https://ollama.com/">Ollama</a>, <a href="https://www.python.org/">Python</a>, and <a href="https://streamlit.io/">Streamlit</a> to offer a straightforward solution for web scraping. This project integrates artificial intelligence and automation to simplify data collection and processing, making it a solid choice for tasks that require efficient and intelligent data extraction. The ultimate goal is to easily collect data for Data Analysis <a href="https://github.com/creativepolymath/">portfolio projects</a>.</p>

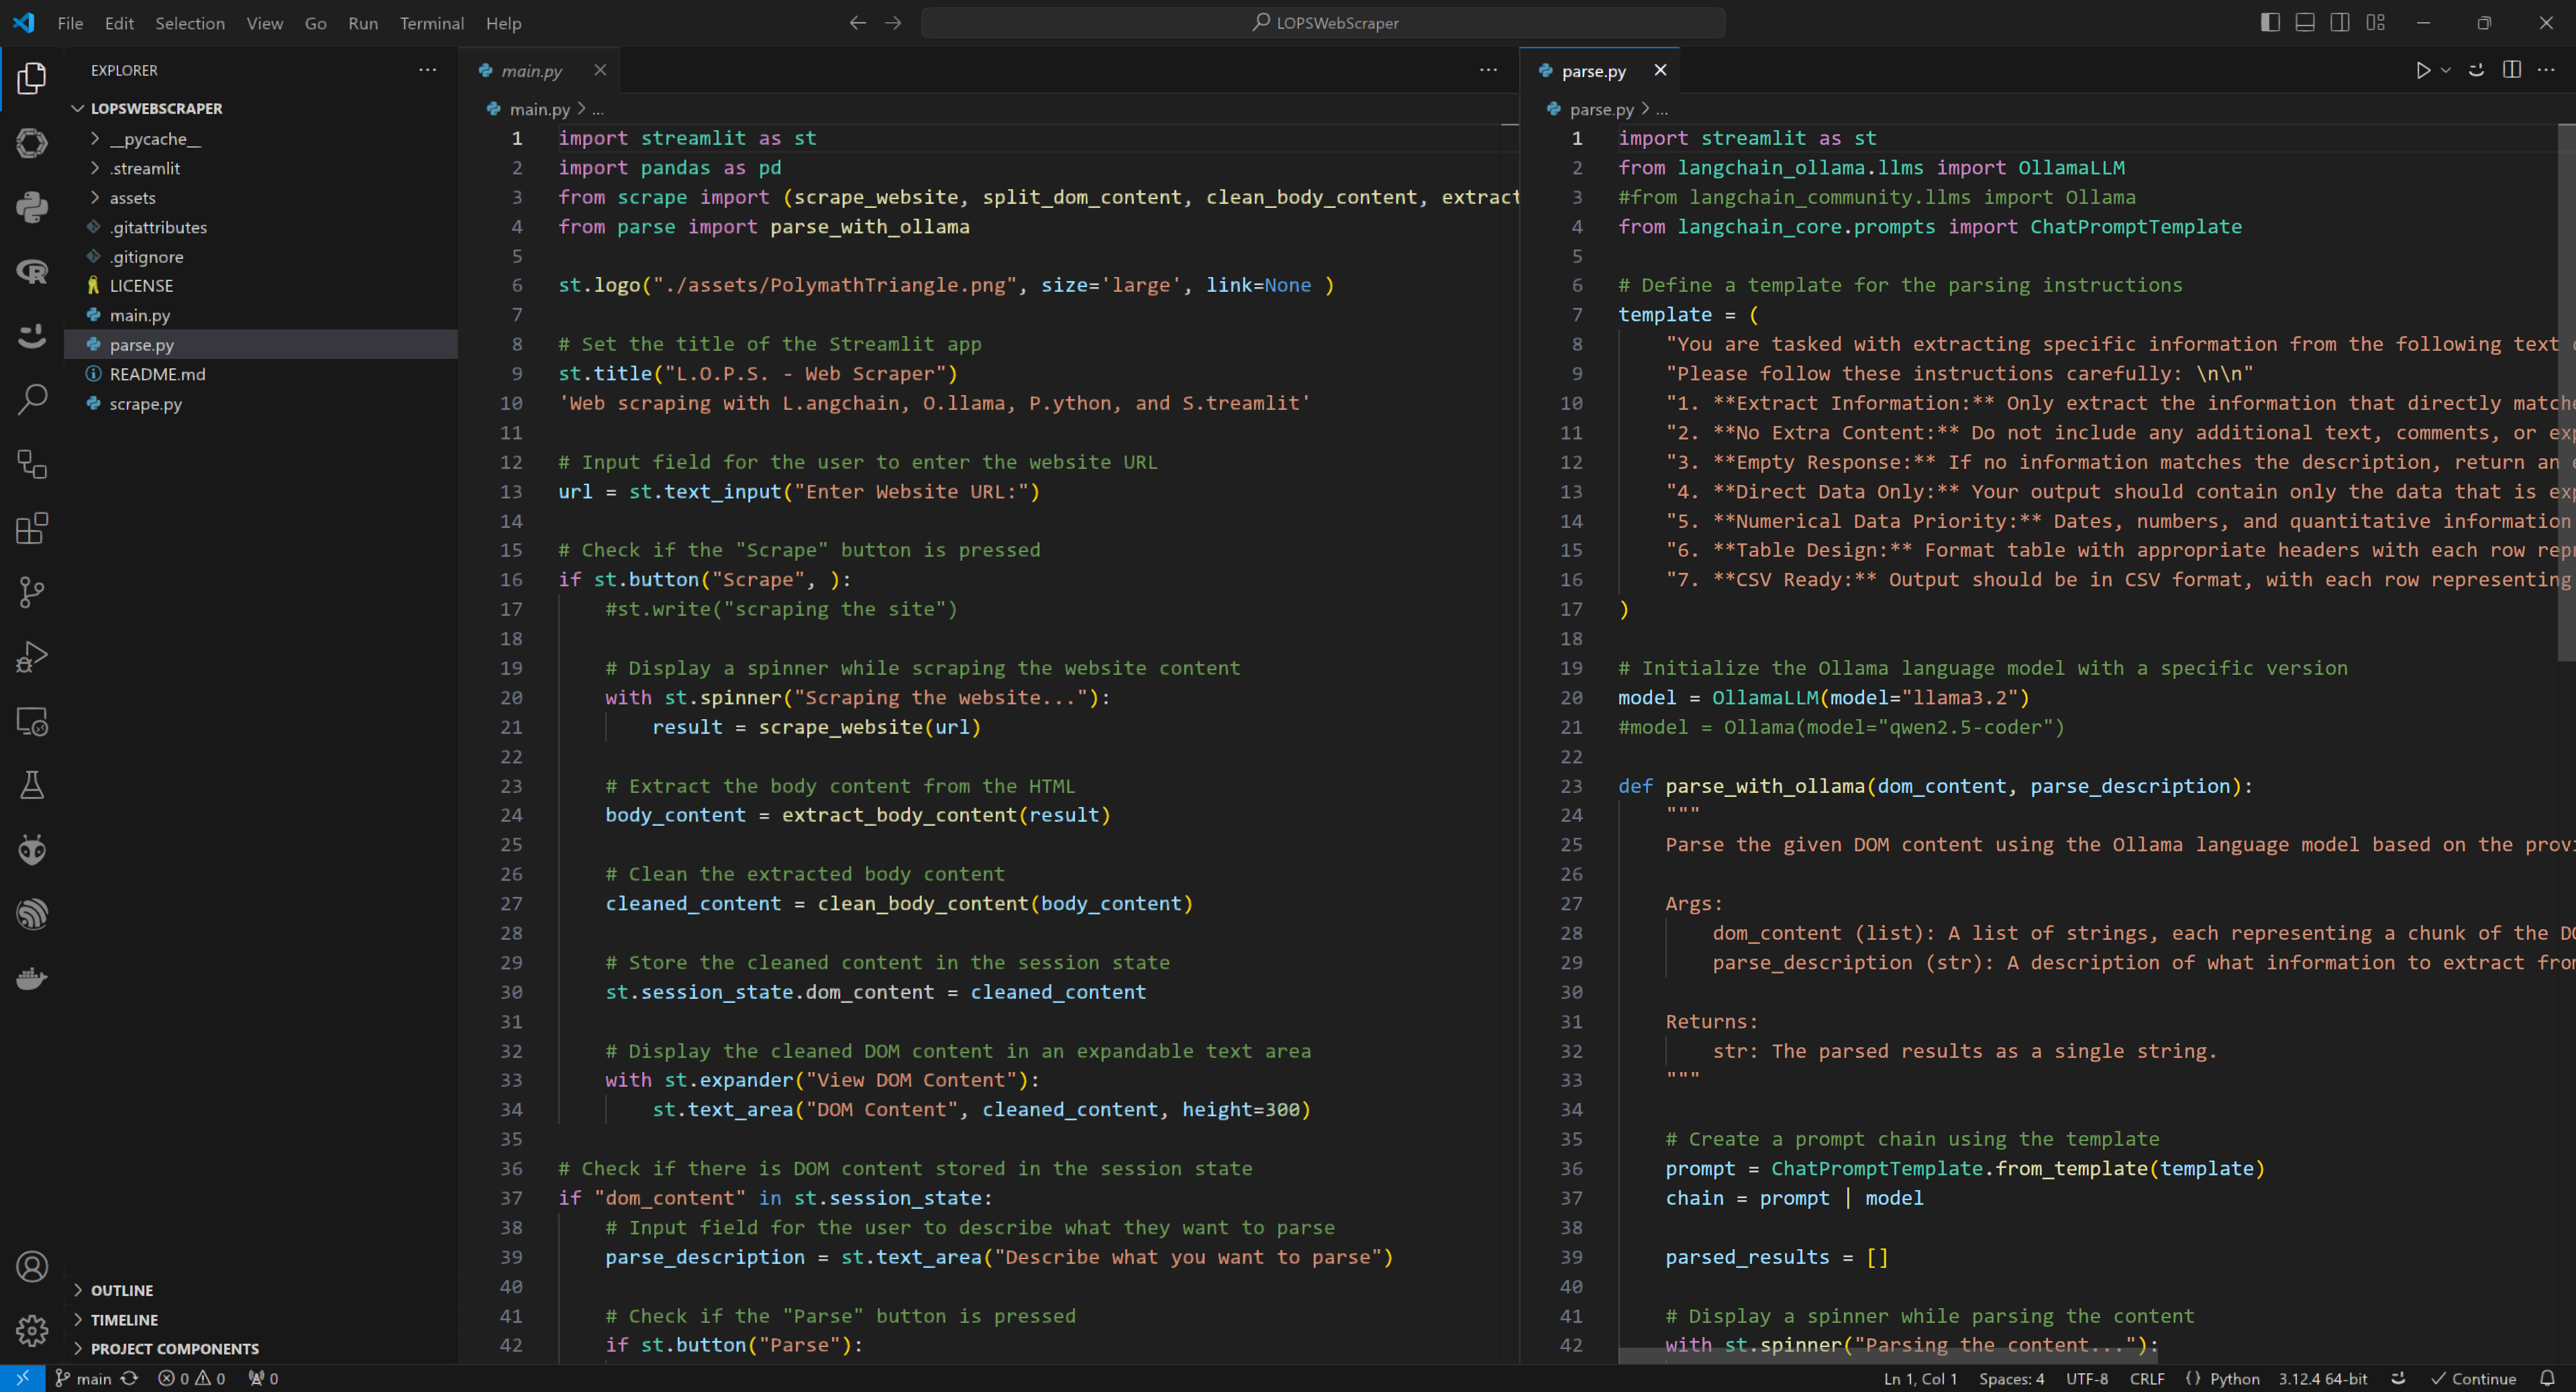
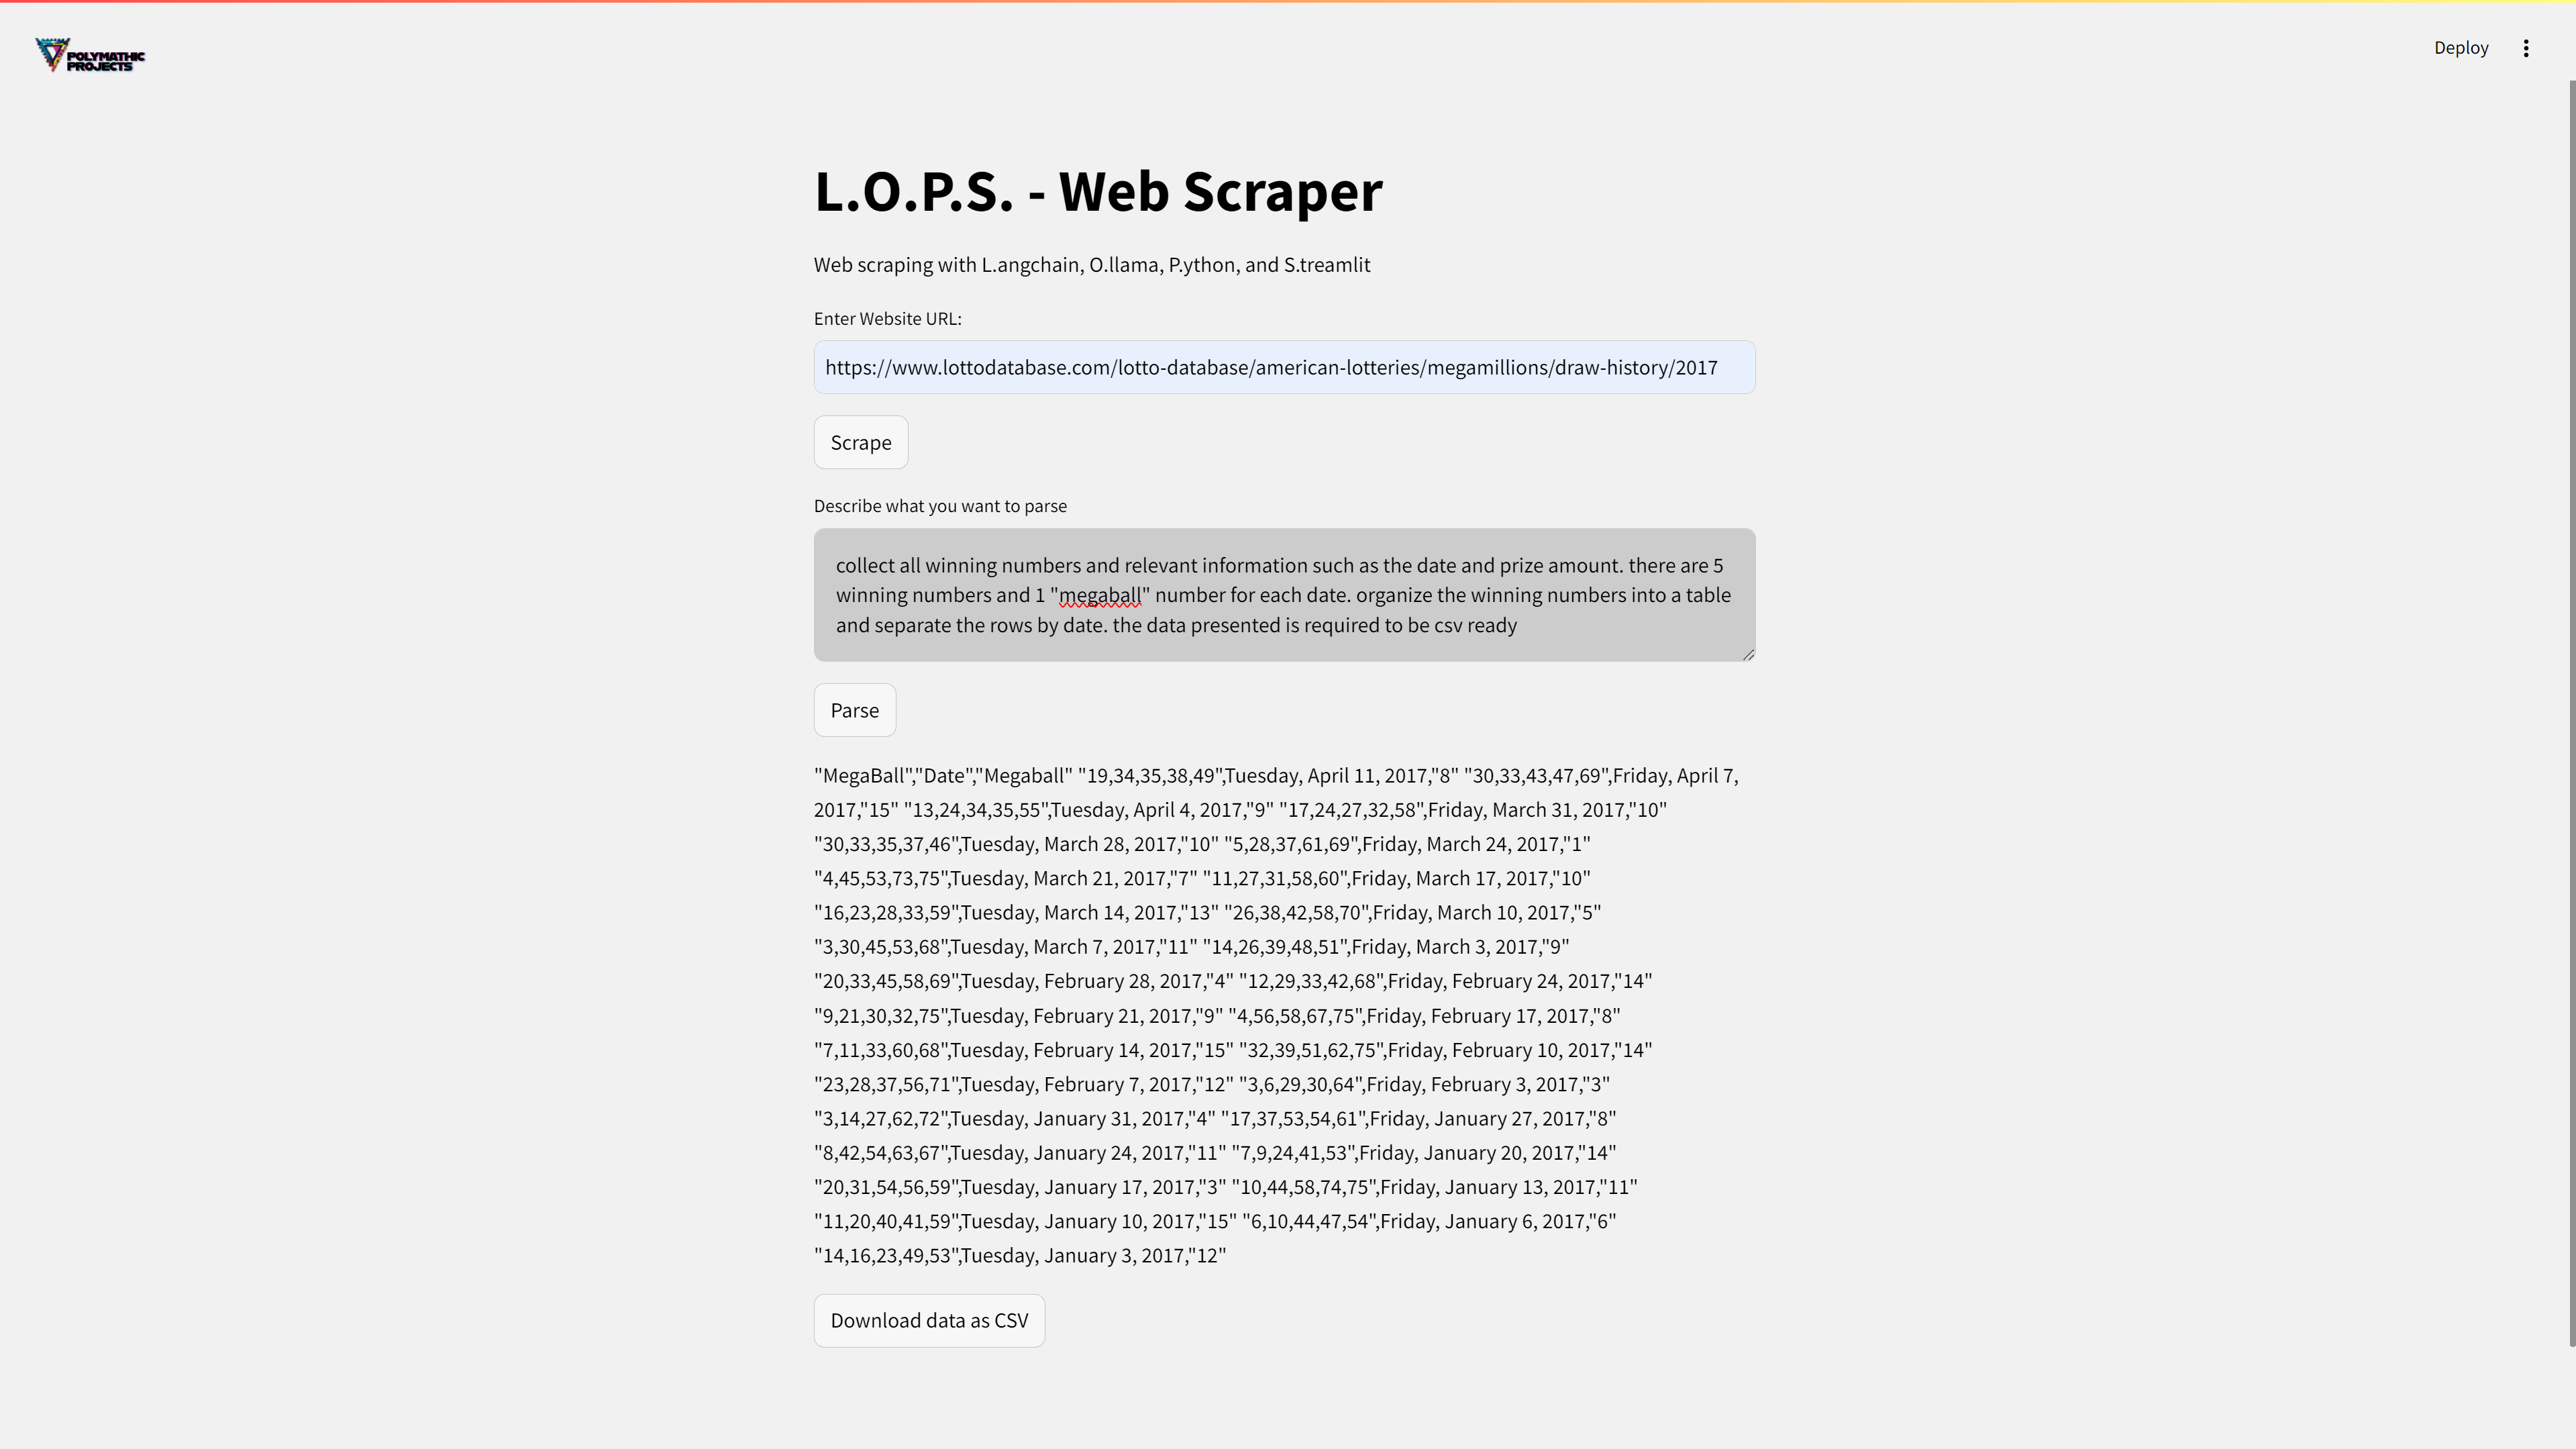
<p><img src="/assets/images/LOPS-scraper-vscode-cap.png" alt="L.O.P.S. Web Interface" /></p>

<p>Combining Langchain, Python, and Ollama for Smart Scraping</p>

<p>L.O.P.S. relies on Langchain’s community plugins to connect with Ollama’s LLM and manage the scraping templates through core prompts. Python provides essential functionality, with pandas handling data structures and custom-built functions that automate repetitive processes. One of the highlights is the self-hosted Ollama server running Llama3.2:3b, giving users the flexibility of local AI processing with the added benefit of privacy and reduced latency.</p>

<p><img src="/assets/images/LOPS-scraper-lottery-cap.png" alt="L.O.P.S. Web Interface" /></p>

<p>User-Friendly Setup with Streamlit and Chrome Integration</p>

<p>The Streamlit interface ensures that inputs, outputs, and theming are easy to manage, offering a smooth user experience without the need for complex coding. The project also emphasizes using the latest Chromedriver.exe from Chrome Developer Downloads to ensure compatibility with modern web pages. Whether you’re gathering product data, tracking trends, or extracting information for research, L.O.P.S. provides a reliable way to handle these tasks. The final function is outputting the data as a CSV file, ready “almost” for use in Excel.</p>

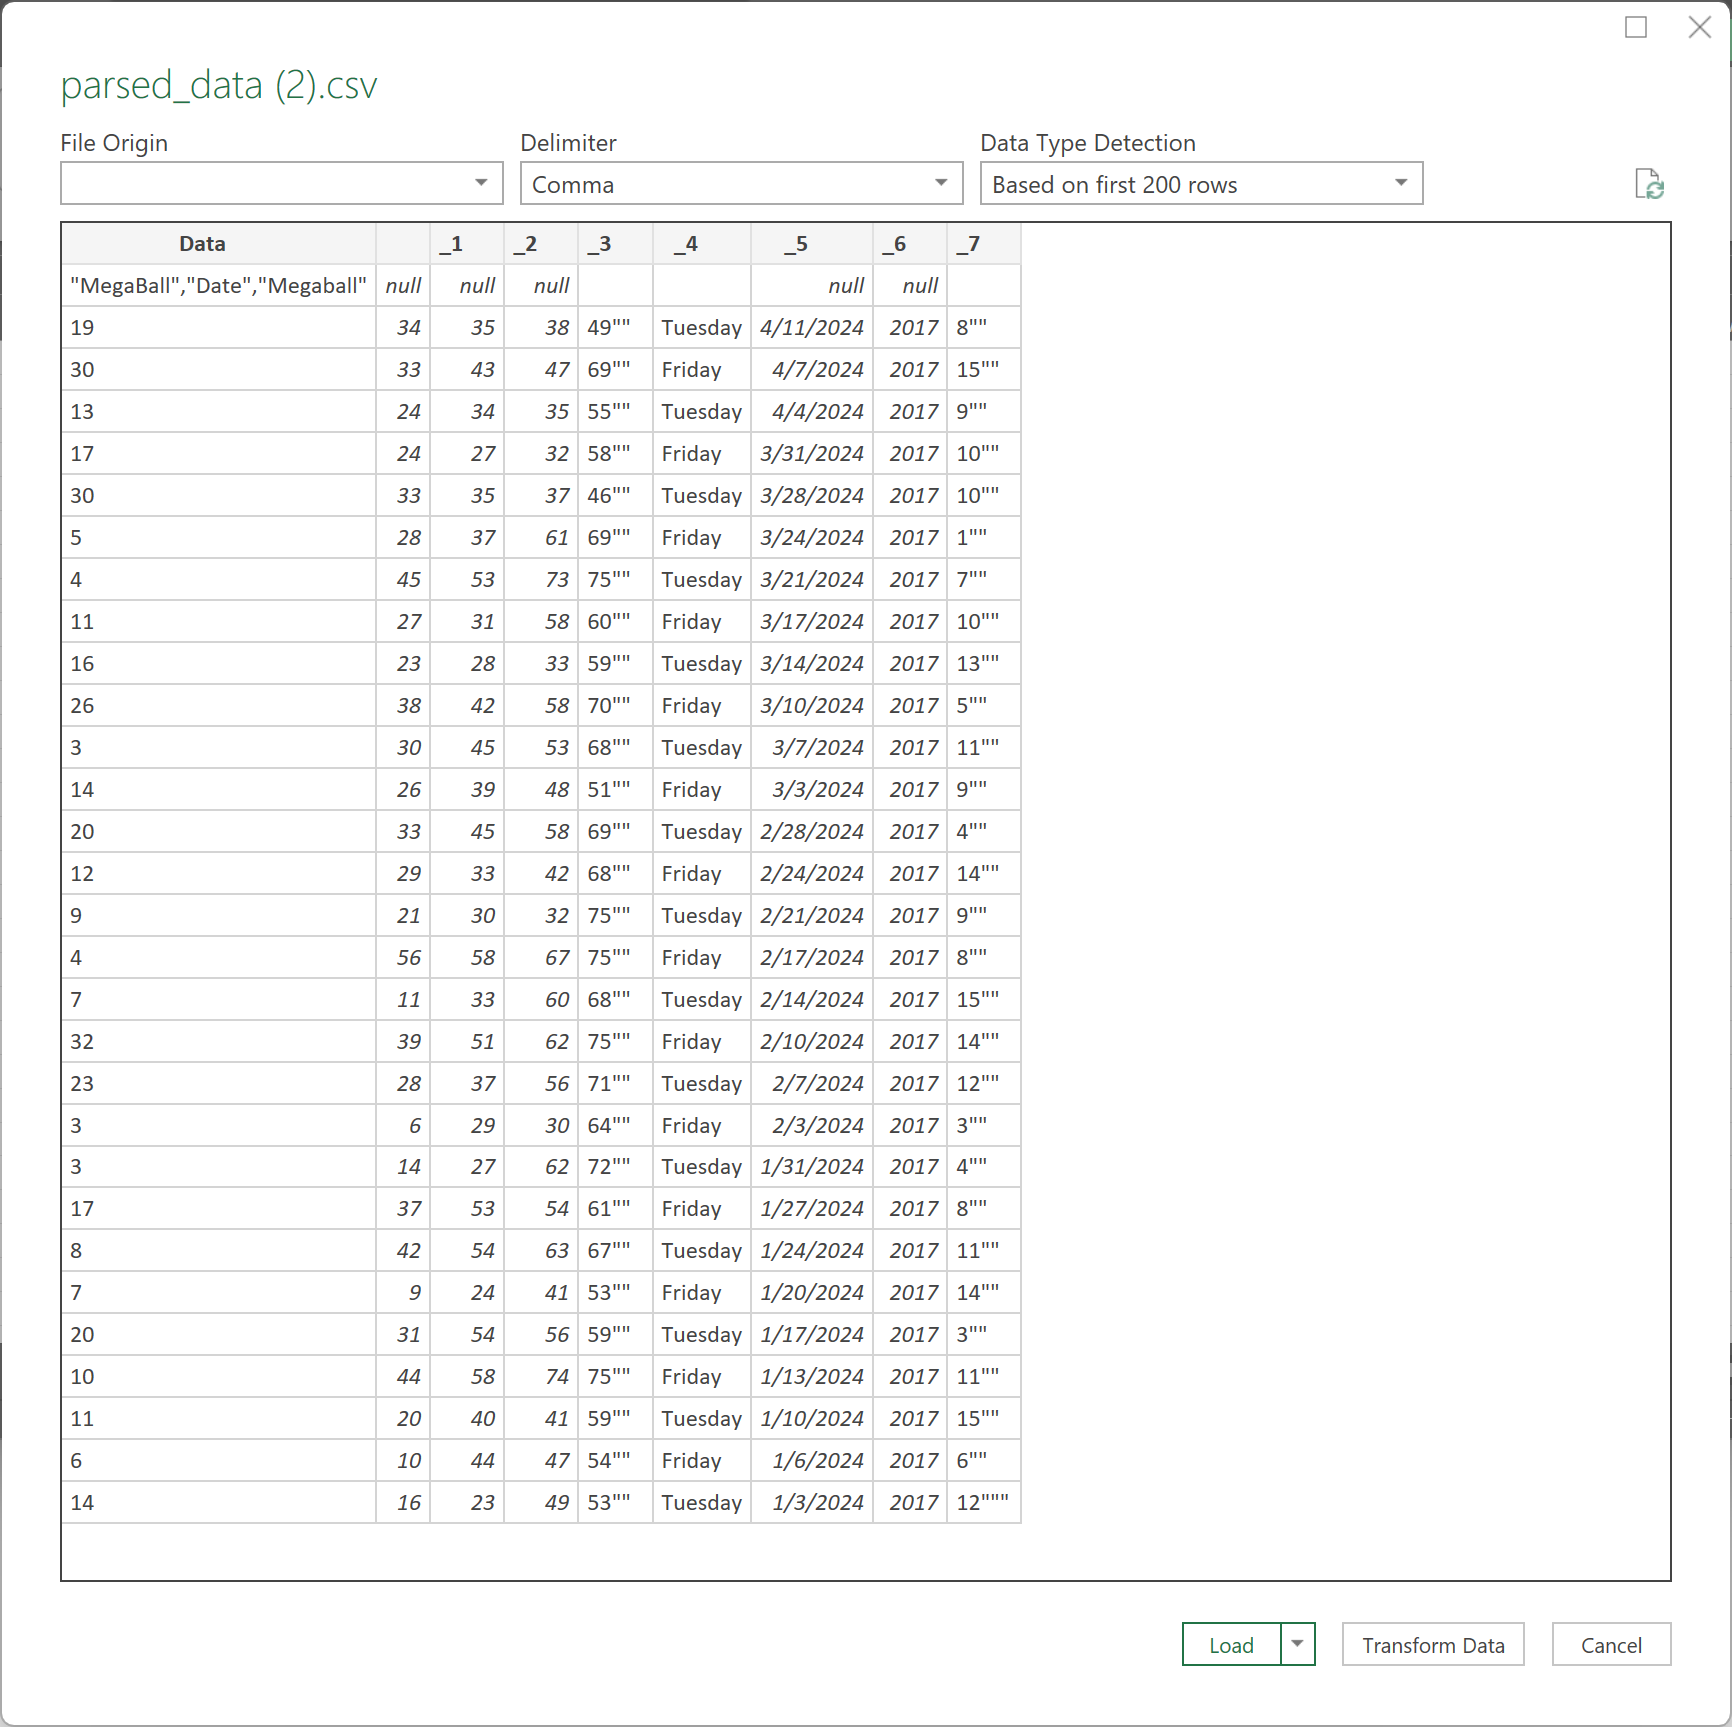
<p><img src="/assets/images/LOPS-scraper-lotteryCSV-cap.png" alt="L.O.P.S. Web Interface" /></p>

<p>L.O.P.S. Web Scraper strikes a balance between functionality and simplicity, giving users the tools they need to efficiently extract and work with data. With just a few setup steps, including installing Chromedriver and configuring the Ollama LLM, you’ll be ready to start scraping smarter.</p>]]></content><author><name>Gregory Whitmore</name></author><category term="blog" /><category term="data" /><category term="ai" /><category term="scraping" /><category term="Langchain" /><category term="Ollama" /><category term="Streamlit" /><category term="Python" /><summary type="html"><![CDATA[The L.O.P.S. Web Scraper is a practical tool that combines Langchain, Ollama, Python, and Streamlit to offer a straightforward solution for web scraping. This project integrates artificial intelligence and automation to simplify data collection and processing, making it a solid choice for tasks that require efficient and intelligent data extraction. The ultimate goal is to easily collect data for Data Analysis portfolio projects.]]></summary></entry><entry><title type="html">Human Resource Analytics</title><link href="https://creativepolymath.github.io/blog/hr-analytics/" rel="alternate" type="text/html" title="Human Resource Analytics" /><published>2024-09-27T15:30:30-04:00</published><updated>2024-09-27T15:30:30-04:00</updated><id>https://creativepolymath.github.io/blog/hr-analytics</id><content type="html" xml:base="https://creativepolymath.github.io/blog/hr-analytics/"><![CDATA[<p>This interactive visualization leverages data to highlight key metrics such as employee demographics, performance, and turnover rates. By presenting this information in a clear and visually appealing manner, the dashboard enables HR professionals to make data-driven decisions that can enhance workforce planning and management.</p>

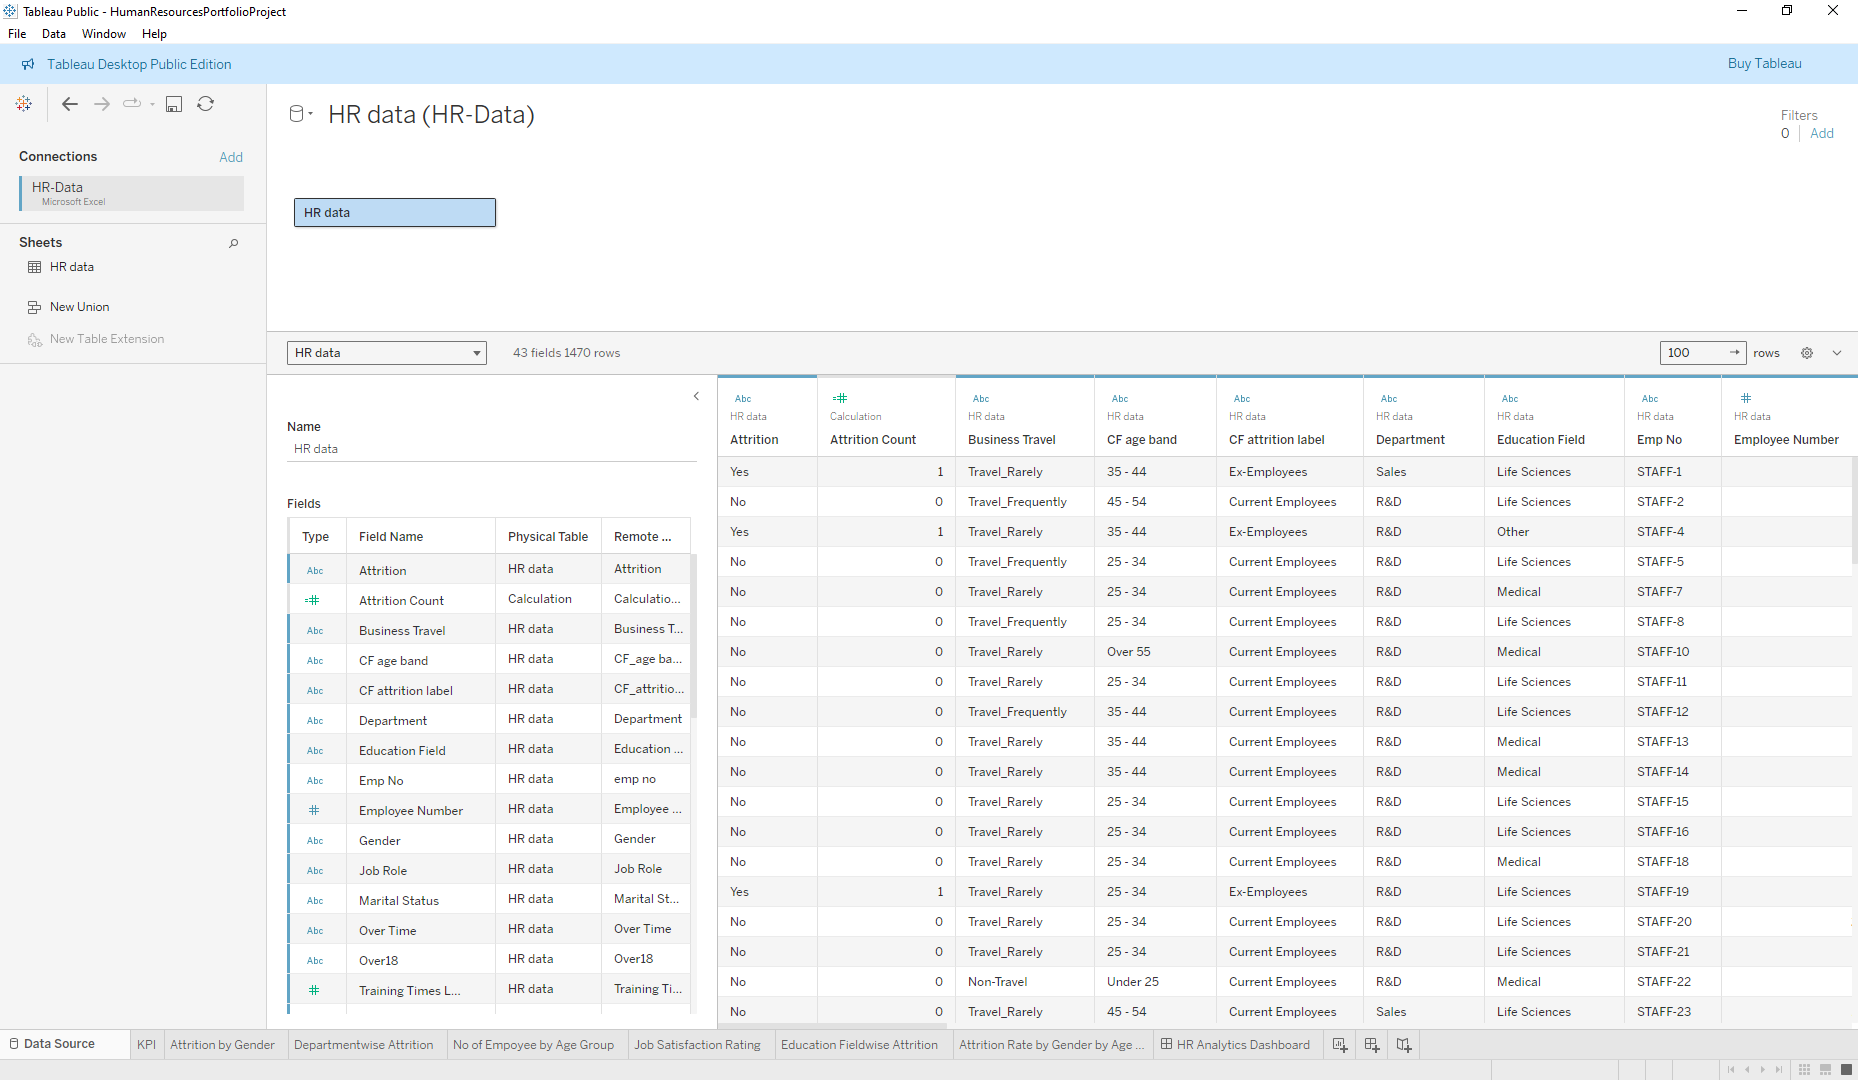
<p>The project was created following a tutorial from <a href="https://www.youtube.com/watch?v=oAIubTqg-Kw">Data Tutorials</a>. The human resources data was provided in an Excel sheet that was well prepared for this data visualization.</p>

<p><img src="/assets/images/Tableau-Data-cap.PNG" alt="Tableau Excel Data" /></p>

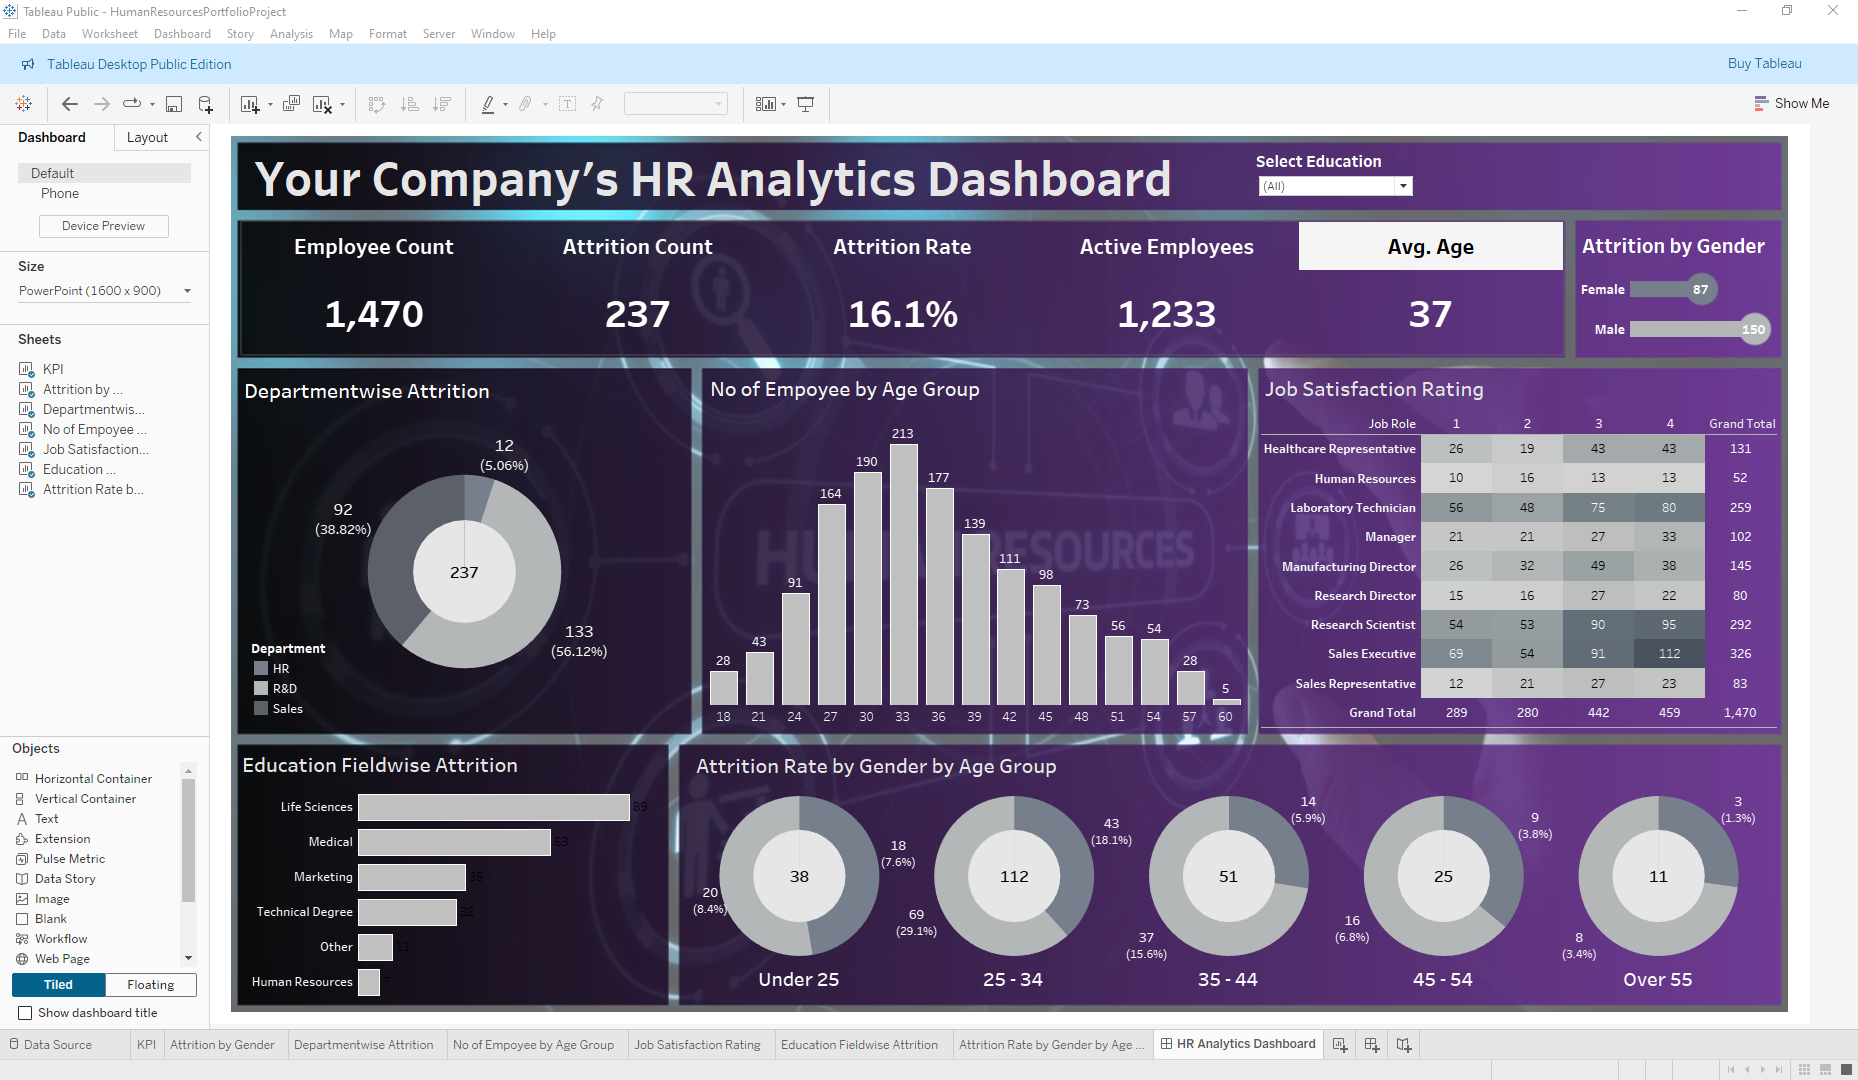
<p>One of the standout features of this dashboard is its ability to break down employee demographics by various categories, including age, gender, and department. This granular view helps organizations understand the composition of their workforce and identify any potential diversity issues. Additionally, the performance metrics section allows managers to track employee performance over time, identifying top performers and those who may need additional support or training. This targeted approach ensures that resources are allocated effectively to maximize employee productivity and satisfaction.</p>

<p><img src="/assets/images/Tableau-Viz-cap.PNG" alt="Tableau Data Visualization Dashboard" /></p>

<p>The dashboard’s interactive elements, such as filters and drill-down capabilities, make it easy to explore the data from different angles and uncover actionable insights. This HR Analytics Dashboard is an essential tool for any organization looking to optimize its human resources strategy through data visualization.</p>

<p>View the final project on <a href="https://public.tableau.com/app/profile/greg.whitmore/viz/HumanResourcesPortfolioProject/HRAnalyticsDashboard">Tableau Public</a></p>]]></content><author><name>Gregory Whitmore</name></author><category term="blog" /><category term="data" /><category term="visualization" /><category term="excel" /><category term="tableau" /><summary type="html"><![CDATA[This interactive visualization leverages data to highlight key metrics such as employee demographics, performance, and turnover rates. By presenting this information in a clear and visually appealing manner, the dashboard enables HR professionals to make data-driven decisions that can enhance workforce planning and management.]]></summary></entry><entry><title type="html">Python and the Weather</title><link href="https://creativepolymath.github.io/blog/python-weather/" rel="alternate" type="text/html" title="Python and the Weather" /><published>2024-09-27T05:30:30-04:00</published><updated>2024-09-27T05:30:30-04:00</updated><id>https://creativepolymath.github.io/blog/python-weather</id><content type="html" xml:base="https://creativepolymath.github.io/blog/python-weather/"><![CDATA[<p>This project focuses on collecting and visualizing historical weather data to uncover trends and patterns over time. By leveraging data from reliable sources such as NOAA, Visual Crossing and others, I aim to provide comprehensive insights into weather changes across different regions. The collected data includes various weather parameters like temperature, precipitation, and wind speed, which are crucial for understanding climate dynamics.</p>

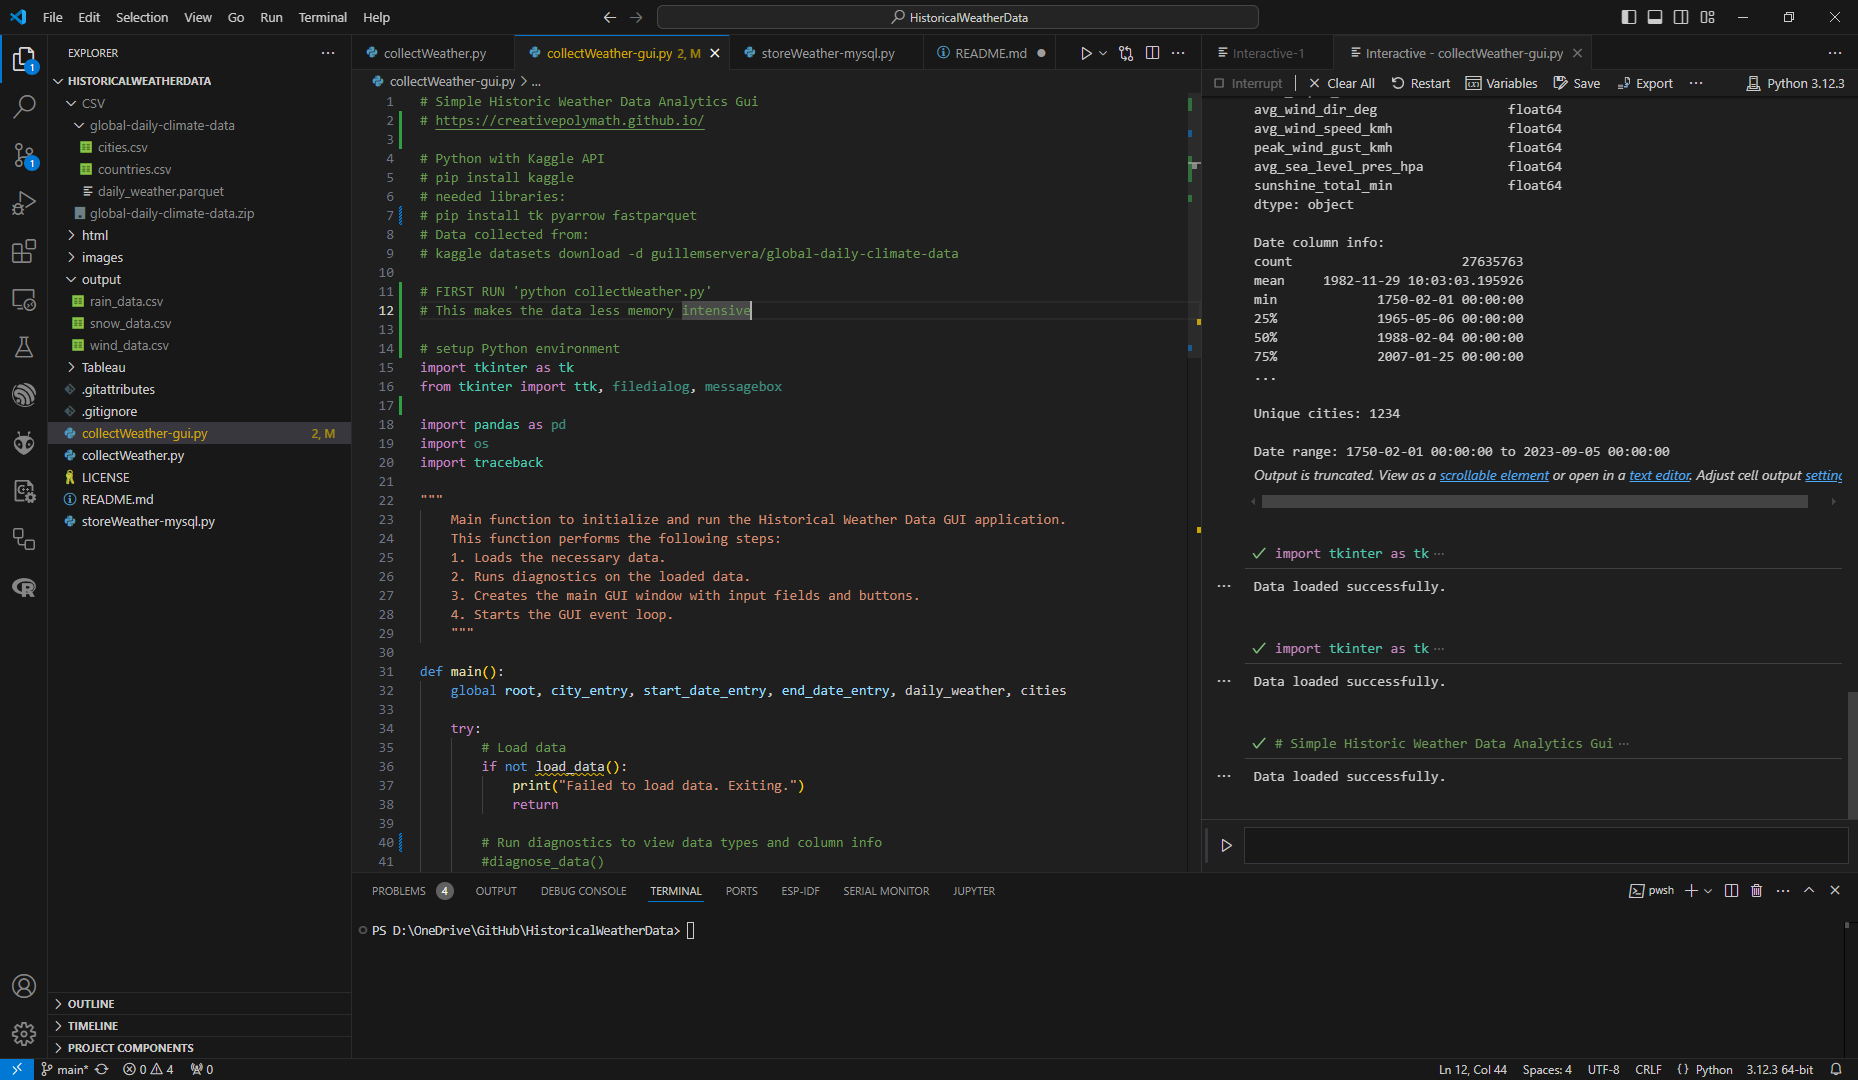
<p><img src="/assets/images/vscode-HWD-cap.png" alt="VSCode" /></p>

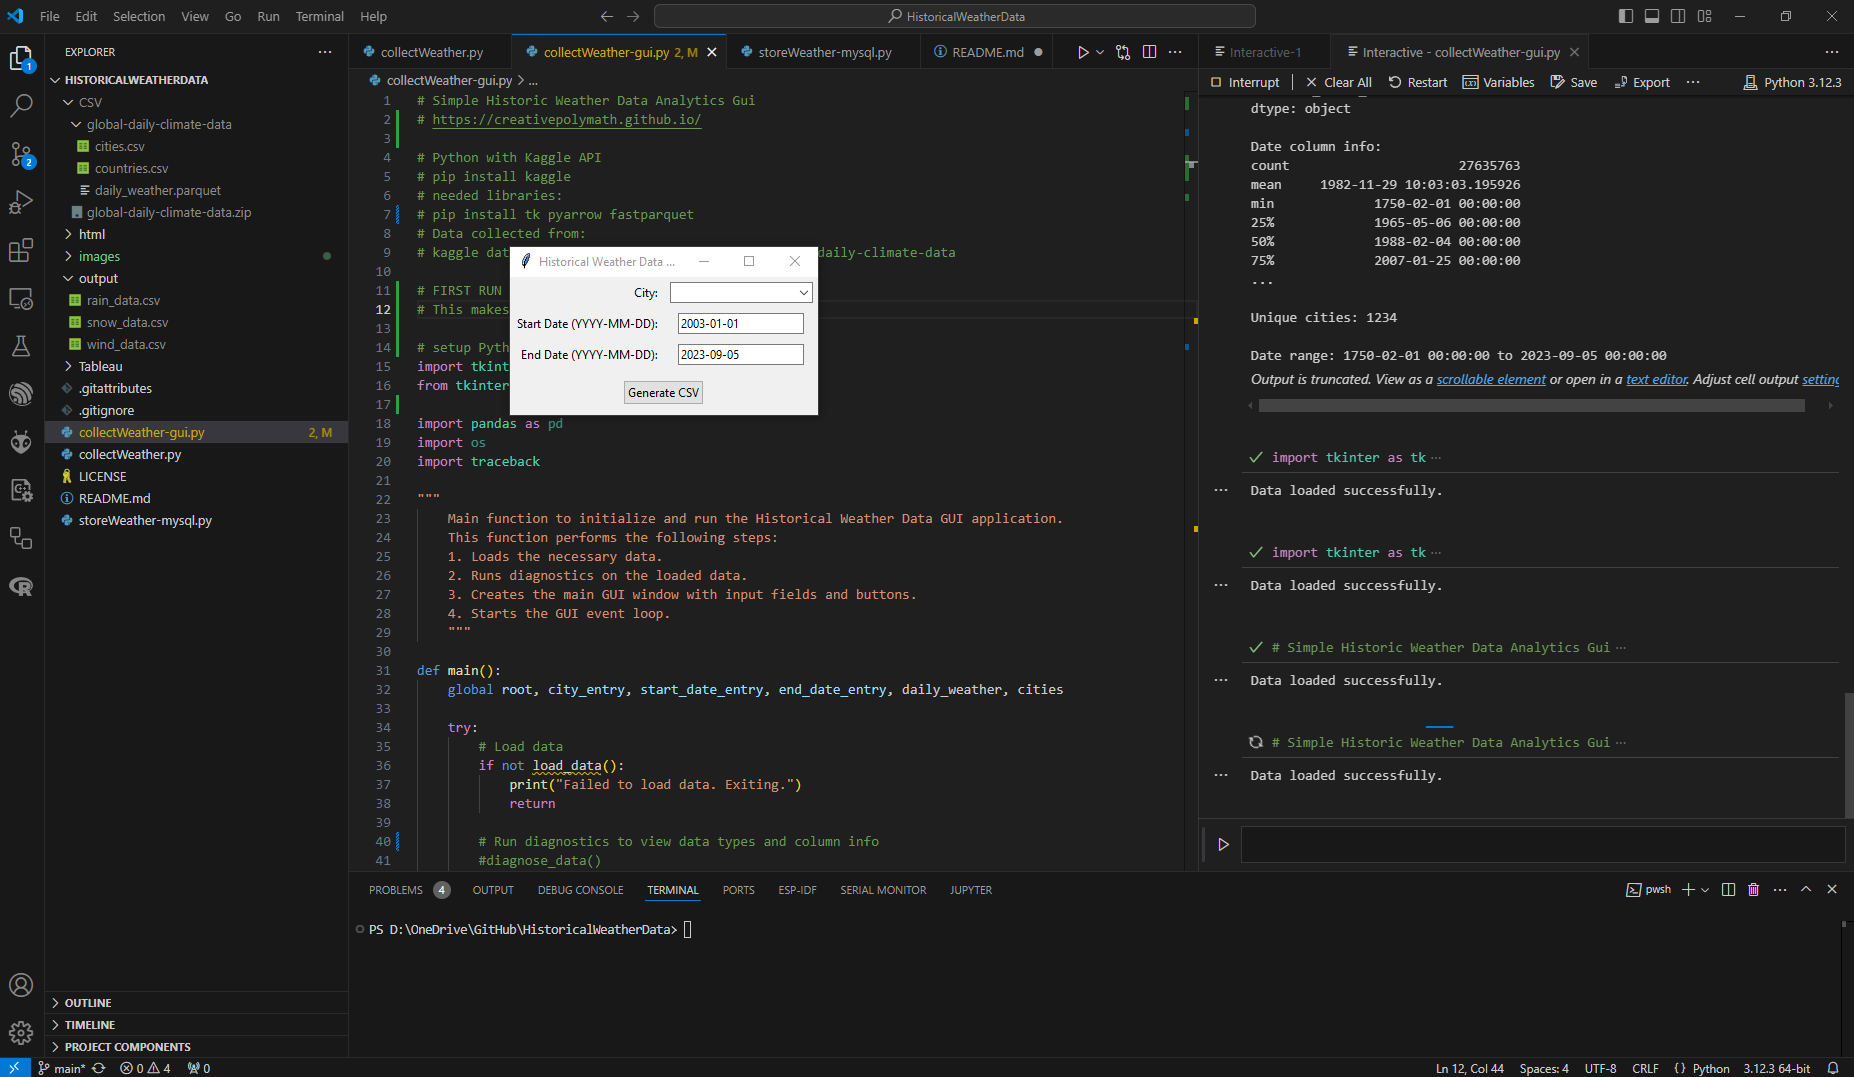
<p>For now, the application is in 2 parts to keep the memory usage low. Initially, it was maxing out 64gb. While I’m learning, this application only runs from the VSCode interactive terminal and you must run ‘collectWeather.py’ before launching the gui.</p>

<p><img src="/assets/images/vscode-HWD-GUI-cap.png" alt="VSCode" /></p>

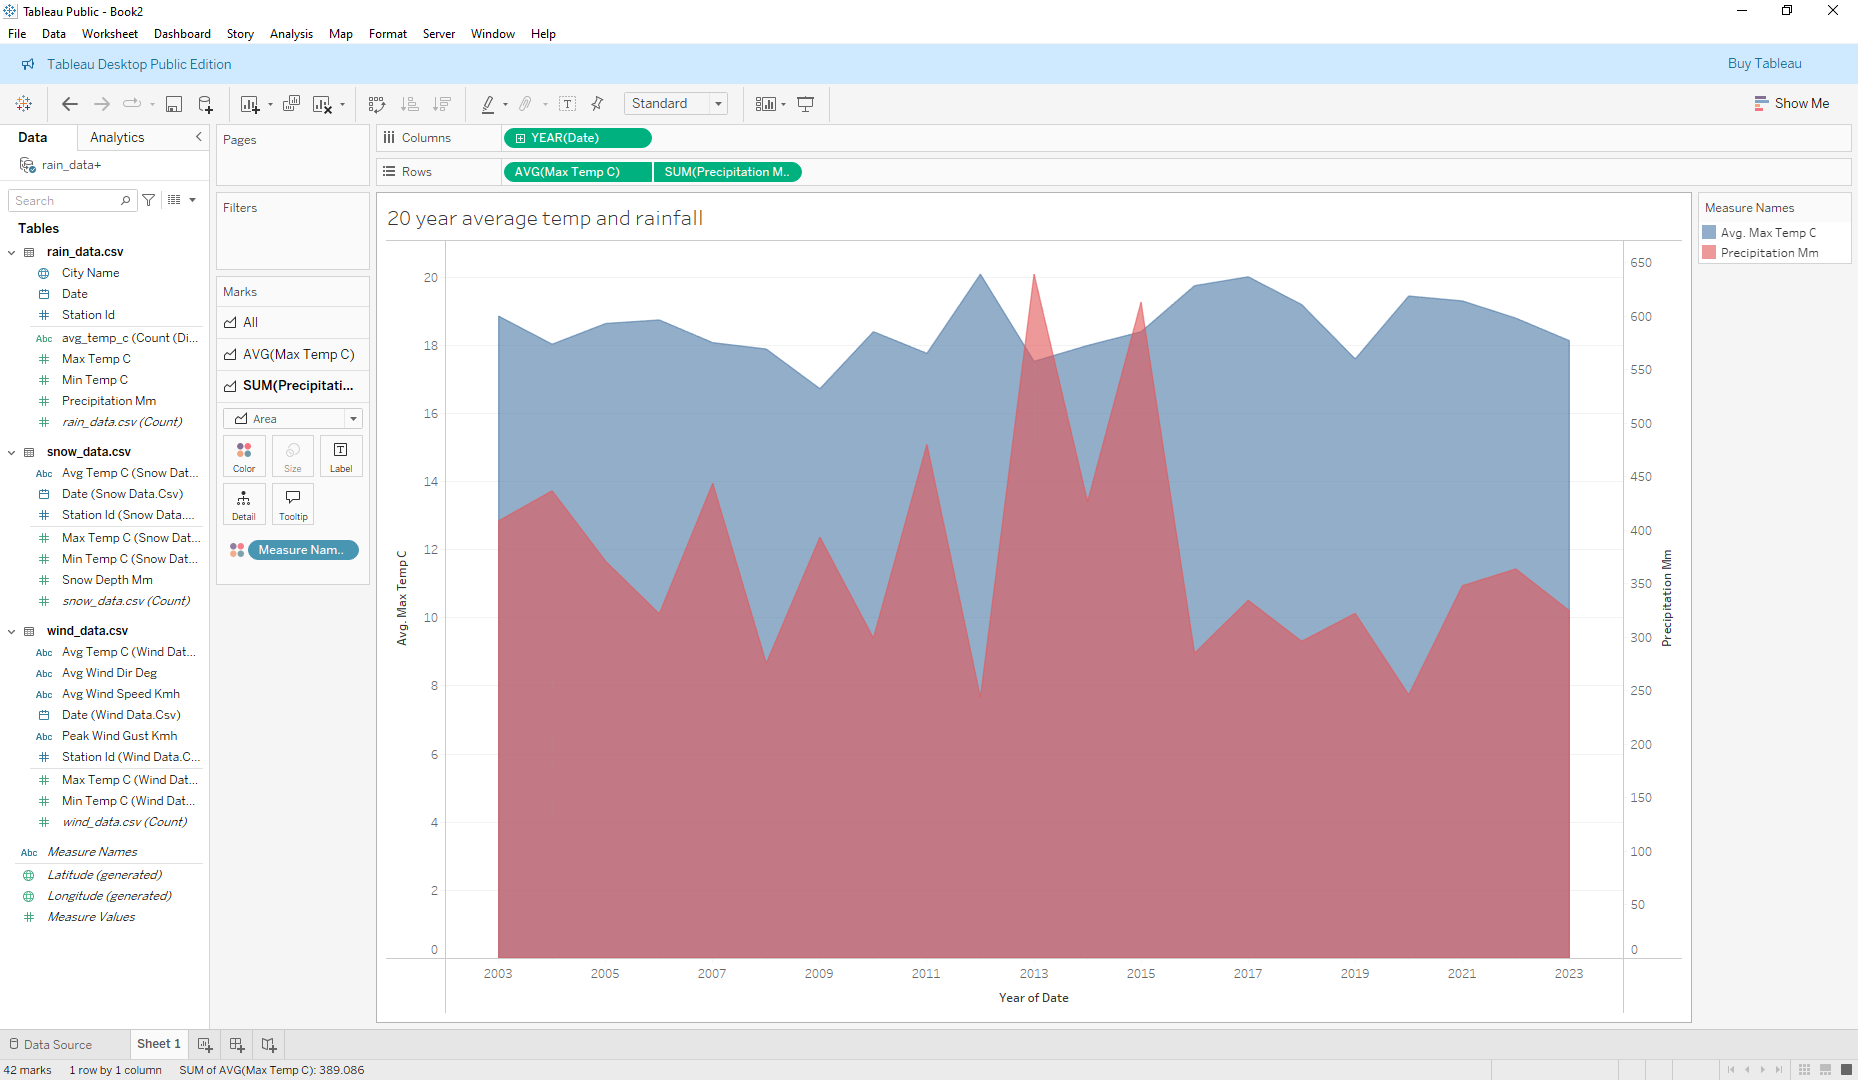
<p>The visualization aspect of this project is designed to make the data more accessible and understandable. Using tools like Python and Tableau, I’m creating interactive dashboards and graphs that allow users to explore the data in a user-friendly manner. These visualizations help in identifying significant weather events, seasonal variations, and long-term climate trends, making the information valuable for researchers, educators, and weather enthusiasts.</p>

<p><img src="/assets/images/tableau-HWD-avgtemp-cap.png" alt="VSCode" /></p>

<p>The full project is on <a href="https://github.com/creativepolymath/HistoricalWeatherData">Github</a></p>]]></content><author><name>Gregory Whitmore</name></author><category term="blog" /><category term="data" /><category term="visualization" /><category term="weather" /><category term="Kaggle" /><category term="Python" /><category term="Tkinter" /><summary type="html"><![CDATA[This project focuses on collecting and visualizing historical weather data to uncover trends and patterns over time. By leveraging data from reliable sources such as NOAA, Visual Crossing and others, I aim to provide comprehensive insights into weather changes across different regions. The collected data includes various weather parameters like temperature, precipitation, and wind speed, which are crucial for understanding climate dynamics.]]></summary></entry><entry><title type="html">Tableau Dashboard: Customer Analysis</title><link href="https://creativepolymath.github.io/blog/customer-analysis/" rel="alternate" type="text/html" title="Tableau Dashboard: Customer Analysis" /><published>2024-09-24T15:30:30-04:00</published><updated>2024-09-24T15:30:30-04:00</updated><id>https://creativepolymath.github.io/blog/customer-analysis</id><content type="html" xml:base="https://creativepolymath.github.io/blog/customer-analysis/"><![CDATA[<p>A quick <a href="https://public.tableau.com/app/profile/greg.whitmore/vizzes">Tableau</a> dashboard was created to learn more about calculated fields, filters, and created custom graphs. This Customer Analysis dashboard contains Revenue by State featured on a repsonsive map as well as a custom donut chart for the Percentage of Revenue per Region graph.</p>

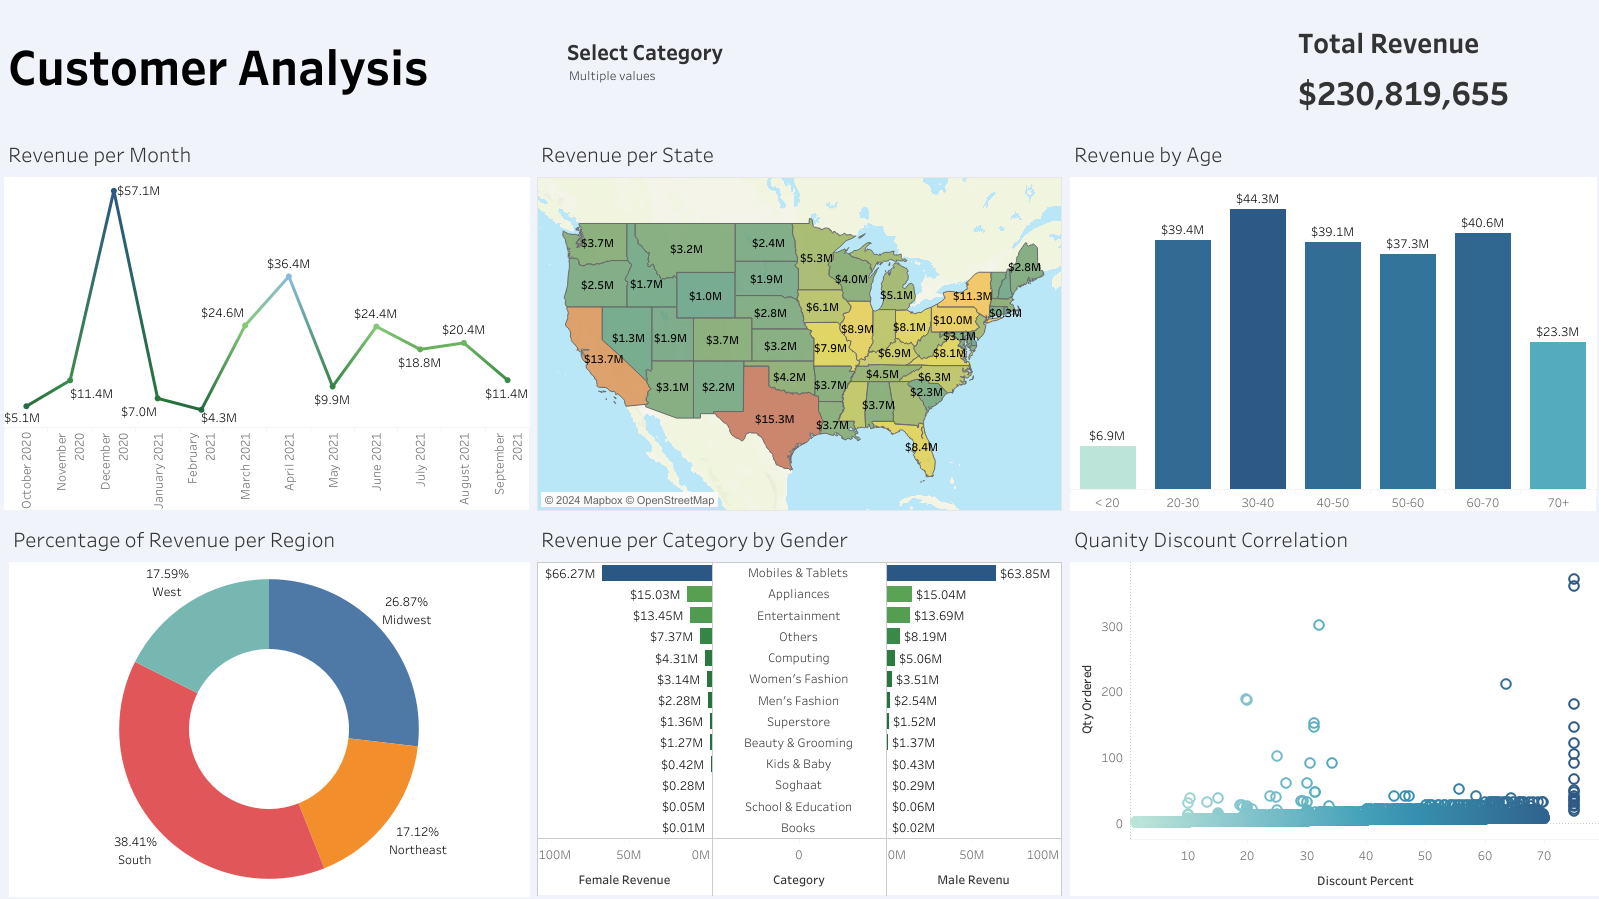
<p><img src="/assets/images/SS-customer-analysis.png" alt="Customer Analysis Dashboard" /></p>

<p>One of the key takeaways is the identification of the most profitable customer segments. By analyzing metrics such as total revenue, average order value, and purchase frequency, the dashboard highlights which customer groups contribute the most to the business’s bottom line. This information is crucial for targeted marketing efforts and resource allocation, ensuring that high-value customers receive the attention and incentives needed to maintain their loyalty.</p>

<p>Another significant insight from the visualization is the breakdown of sales by region, product category, and time period. This granular view allows businesses to pinpoint trends and seasonal variations in customer purchases. For instance, certain regions may show higher demand for specific products during particular months, enabling more effective inventory management and promotional strategies. Additionally, the ability to drill down into individual customer profiles and transaction histories provides a deeper understanding of customer preferences and behaviors, facilitating personalized marketing and improved customer satisfaction.</p>

<p><a href="https://public.tableau.com/app/profile/greg.whitmore/viz/CustomerAnalysis_17272105095310/CustomerAnalysis">Customer Analysis Tableau Dashboard</a></p>]]></content><author><name>Gregory Whitmore</name></author><category term="blog" /><category term="data" /><category term="visualization" /><category term="Tableau" /><summary type="html"><![CDATA[A quick Tableau dashboard was created to learn more about calculated fields, filters, and created custom graphs. This Customer Analysis dashboard contains Revenue by State featured on a repsonsive map as well as a custom donut chart for the Percentage of Revenue per Region graph.]]></summary></entry><entry><title type="html">Dual Learning on Kaggle</title><link href="https://creativepolymath.github.io/blog/dual-learning-kaggle/" rel="alternate" type="text/html" title="Dual Learning on Kaggle" /><published>2024-09-24T05:30:30-04:00</published><updated>2024-09-24T05:30:30-04:00</updated><id>https://creativepolymath.github.io/blog/dual-learning-kaggle</id><content type="html" xml:base="https://creativepolymath.github.io/blog/dual-learning-kaggle/"><![CDATA[<p><a href="https://www.kaggle.com/gregwhitmore">Kaggle</a> is an excellent platform for dual learning Python and R, especially for data analytics and visualization. It offers a vast array of datasets and competitions that cater to both beginners and advanced users. By participating in these competitions, you can practice coding in both languages, compare their functionalities, and understand their strengths and weaknesses in various scenarios. <a href="https://www.kaggle.com/">Kaggle’s</a> community-driven approach allows you to learn from other users’ code and solutions, providing a collaborative environment where you can improve your skills. Additionally, Kaggle’s notebooks support both Python and R, making it easy to switch between languages and apply them to real-world data problems.</p>

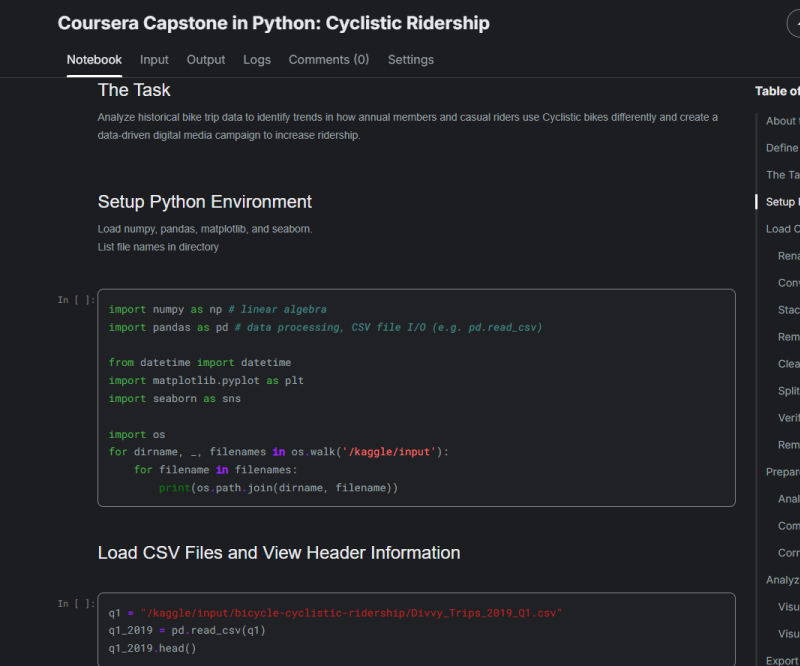
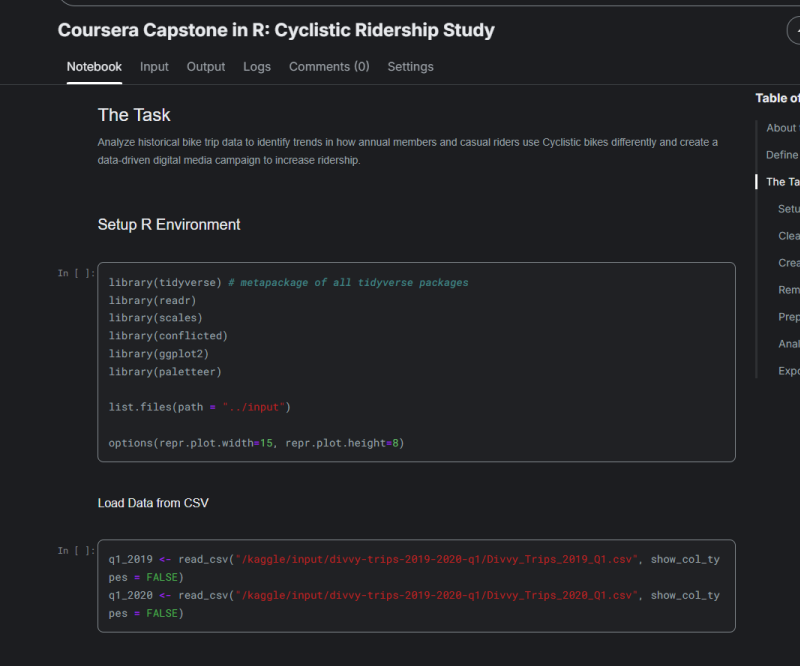
<p><img src="/assets/images/python-cap.png" alt="Python" /></p>

<p><a href="https://www.kaggle.com/gregwhitmore">Kaggle</a> provides numerous tutorials and courses that cover a wide range of topics in data science, from basic data manipulation to advanced machine learning techniques. These resources are invaluable for building a strong foundation in both Python and R. By working through these tutorials, you can gain hands-on experience with data visualization libraries such as <a href="https://matplotlib.org/">Matplotlib</a>, Seaborn, and <a href="https://ggplot2.tidyverse.org/">ggplot2</a>. This dual learning approach not only enhances your versatility as a data analyst but also prepares you to tackle diverse data challenges in your professional career. Whether you’re analyzing weather patterns, cycling data, or financial trends, <a href="https://www.kaggle.com/">Kaggle’s</a> resources can help you develop the skills needed to create insightful and impactful visualizations.</p>

<p><img src="/assets/images/R-cap.png" alt="R" /></p>]]></content><author><name>Gregory Whitmore</name></author><category term="blog" /><category term="data" /><category term="visualization" /><category term="python" /><category term="R" /><category term="Kaggle" /><summary type="html"><![CDATA[Kaggle is an excellent platform for dual learning Python and R, especially for data analytics and visualization. It offers a vast array of datasets and competitions that cater to both beginners and advanced users. By participating in these competitions, you can practice coding in both languages, compare their functionalities, and understand their strengths and weaknesses in various scenarios. Kaggle’s community-driven approach allows you to learn from other users’ code and solutions, providing a collaborative environment where you can improve your skills. Additionally, Kaggle’s notebooks support both Python and R, making it easy to switch between languages and apply them to real-world data problems.]]></summary></entry><entry><title type="html">Cyclistic Case Study</title><link href="https://creativepolymath.github.io/blog/cyclistic-case-study/" rel="alternate" type="text/html" title="Cyclistic Case Study" /><published>2024-09-21T15:34:30-04:00</published><updated>2024-09-21T15:34:30-04:00</updated><id>https://creativepolymath.github.io/blog/cyclistic-case-study</id><content type="html" xml:base="https://creativepolymath.github.io/blog/cyclistic-case-study/"><![CDATA[<p>In today’s data-driven world, the ability to analyze and interpret data is crucial for making informed decisions. As part of the Data Analytics Certificate program, this capstone project focuses on the Cyclistic bike-sharing dataset, which provides a rich source of information on bike usage patterns in a major metropolitan area. By leveraging this dataset, I aim to uncover insights into user behavior, identify trends, and provide actionable recommendations to enhance the bike-sharing experience. This project not only demonstrates the practical application of data analytics skills but also contributes to the growing field of sustainable urban transportation.</p>

<h1 id="about-the-company">About the Company</h1>

<p>In 2016, Cyclistic launched a successful bike-share offering. Since then, the program has grown to a fleet of 5,824 bicycles that are geo-tracked and locked into a network of 692 stations across Chicago. The bikes can be unlocked from one station and return to any other station in the system anytime. Until now, Cyclistic’s marketing strategy relied on building general awareness and appealing to broad consumer segments. One approach that helped make these things possible was the flexibility of its pricing plans: single-ride passes, full-day passes, and annual memberships.<br /></p>

<p>Customers who purchase single-ride or full-day passes are referred to as casual riders. Customers who purchase annual memberships are Cyclistic members. Cyclistic’s finance analysts have concluded that annual members are much more profitable than casual riders. Although the pricing flexibility helps Cyclistic attract more customers, Moreno believes that maximizing the number of annual members will be key to future growth. Rather than creating a marketing campaign that targets all new customers, Moreno believes there is a very good chance to convert casual riders into members. She notes that casual riders are already aware of the Cyclistic program and have chosen Cyclistic for their mobility needs.<br /></p>

<p>Moreno has set a clear goal: Design marketing strategies aimed at converting casual riders into annual members. To do that, however, the marketing analyst team needs to better understand how annual members and casual riders differ, why casual riders would buy a membership, and how digital media could affect their marketing tactics. Moreno and her team are interested in analyzing the Cyclistic historical bike trip data to identify trends.</p>

<h1 id="define-the-problem">Define the Problem</h1>

<p>The main problem for the director of marketing and marketing analytics team is this: Design marketing strategies aimed at converting Cyclistic’s casual riders into annual members. There are three questions that will guide this future marketing program. For the scope of this project, I will answer the following questions:</p>

<ul>
  <li>How do annual members and casual riders use Cyclistic bikes differently?</li>
  <li>Why would casual riders buy Cyclistic annual memberships?</li>
  <li>How can Cyclistic use digital media to influence casual riders to become members?</li>
</ul>

<p>By analyzing the data, we can identify broad patterns within the two groups. Understanding these differences will enable us to create more accurate customer profiles for each group. These insights will assist the marketing analytics team in designing high-quality, targeted marketing strategies to convert casual riders into members. For the Cyclistic executive team, these insights will help maximize the number of annual members and drive future growth for the company.</p>

<h1 id="the-task">The Task</h1>

<p>Analyze historical bike trip data to identify trends in how annual members and casual riders use Cyclistic bikes differently and create a data-driven digital media campaign to increase ridership.</p>

<h1 id="environment-setup">Environment Setup</h1>

<ul>
  <li>readr for loading CSV files</li>
  <li>scales for better graph scales</li>
  <li>tidyverse and dplyr for knitting file</li>
  <li>conflicted to manage and set conflict repairs</li>
  <li>ggplot2 for visuals</li>
  <li>fontawesome &amp; paletteer for a pretty notebook</li>
</ul>

<h2 id="load-data-from-csv">Load Data from CSV</h2>

<div class="language-r highlighter-rouge"><div class="highlight"><pre class="highlight"><code><span class="n">q1_2019</span><span class="w"> </span><span class="o">&lt;-</span><span class="w"> </span><span class="n">read_csv</span><span class="p">(</span><span class="s2">"CSV/Divvy_Trips_2019_Q1.csv"</span><span class="p">)</span><span class="w">
</span><span class="n">q1_2020</span><span class="w"> </span><span class="o">&lt;-</span><span class="w"> </span><span class="n">read_csv</span><span class="p">(</span><span class="s2">"CSV/Divvy_Trips_2020_Q1.csv"</span><span class="p">)</span><span class="w">
</span></code></pre></div></div>

<h1 id="clean-and-combine">Clean and Combine</h1>
<h2 id="verify-column-names">Verify Column Names</h2>

<div class="language-r highlighter-rouge"><div class="highlight"><pre class="highlight"><code><span class="n">colnames</span><span class="p">(</span><span class="n">q1_2019</span><span class="p">)</span><span class="w">
</span><span class="n">colnames</span><span class="p">(</span><span class="n">q1_2020</span><span class="p">)</span><span class="w">
</span></code></pre></div></div>

<h3 id="rename-columns-of-q1_2019csv-for-consistency">Rename Columns of ‘q1_2019.csv’ for Consistency</h3>

<div class="language-r highlighter-rouge"><div class="highlight"><pre class="highlight"><code><span class="n">q1_2019</span><span class="w"> </span><span class="o">&lt;-</span><span class="w"> </span><span class="n">rename</span><span class="p">(</span><span class="n">q1_2019</span><span class="w">
 </span><span class="p">,</span><span class="n">ride_id</span><span class="w"> </span><span class="o">=</span><span class="w"> </span><span class="n">trip_id</span><span class="w">
 </span><span class="p">,</span><span class="n">rideable_type</span><span class="w"> </span><span class="o">=</span><span class="w"> </span><span class="n">bikeid</span><span class="w">
 </span><span class="p">,</span><span class="n">started_at</span><span class="w"> </span><span class="o">=</span><span class="w"> </span><span class="n">start_time</span><span class="w">
 </span><span class="p">,</span><span class="n">ended_at</span><span class="w"> </span><span class="o">=</span><span class="w"> </span><span class="n">end_time</span><span class="w">
 </span><span class="p">,</span><span class="n">start_station_name</span><span class="w"> </span><span class="o">=</span><span class="w"> </span><span class="n">from_station_name</span><span class="w">
 </span><span class="p">,</span><span class="n">start_station_id</span><span class="w"> </span><span class="o">=</span><span class="w"> </span><span class="n">from_station_id</span><span class="w">
 </span><span class="p">,</span><span class="n">end_station_name</span><span class="w"> </span><span class="o">=</span><span class="w"> </span><span class="n">to_station_name</span><span class="w">
 </span><span class="p">,</span><span class="n">end_station_id</span><span class="w"> </span><span class="o">=</span><span class="w"> </span><span class="n">to_station_id</span><span class="w">
 </span><span class="p">,</span><span class="n">member_casual</span><span class="w"> </span><span class="o">=</span><span class="w"> </span><span class="n">usertype</span><span class="w">
 </span><span class="p">)</span><span class="w">
</span></code></pre></div></div>

<h2 id="inspect-the-dataframes">Inspect the Dataframes</h2>

<div class="language-r highlighter-rouge"><div class="highlight"><pre class="highlight"><code><span class="n">str</span><span class="p">(</span><span class="n">q1_2019</span><span class="p">)</span><span class="w">
</span><span class="n">str</span><span class="p">(</span><span class="n">q1_2020</span><span class="p">)</span><span class="w">
</span></code></pre></div></div>

<h3 id="convert-ride_id-and-rideable_type-columns-to-chr">Convert ride_id and rideable_type columns to CHR</h3>

<div class="language-r highlighter-rouge"><div class="highlight"><pre class="highlight"><code><span class="n">q1_2019</span><span class="w"> </span><span class="o">&lt;-</span><span class="w"> </span><span class="n">mutate</span><span class="p">(</span><span class="n">q1_2019</span><span class="p">,</span><span class="w"> </span><span class="n">ride_id</span><span class="w"> </span><span class="o">=</span><span class="w"> </span><span class="nf">as.character</span><span class="p">(</span><span class="n">ride_id</span><span class="p">),</span><span class="w"> </span><span class="n">rideable_type</span><span class="w"> </span><span class="o">=</span><span class="w"> </span><span class="nf">as.character</span><span class="p">(</span><span class="n">rideable_type</span><span class="p">))</span><span class="w">
</span></code></pre></div></div>

<div class="language-r highlighter-rouge"><div class="highlight"><pre class="highlight"><code><span class="n">str</span><span class="p">(</span><span class="n">q1_2019</span><span class="p">)</span><span class="w">
</span></code></pre></div></div>

<h1 id="create-and-clean-new-table-all_trips">Create and Clean New Table ‘all_trips’</h1>
<h2 id="stack-quarter-dataframes-into-one">Stack Quarter Dataframes into One</h2>

<div class="language-r highlighter-rouge"><div class="highlight"><pre class="highlight"><code><span class="n">all_trips</span><span class="w"> </span><span class="o">&lt;-</span><span class="w"> </span><span class="n">bind_rows</span><span class="p">(</span><span class="n">q1_2019</span><span class="p">,</span><span class="w"> </span><span class="n">q1_2020</span><span class="p">)</span><span class="w">
</span></code></pre></div></div>

<h2 id="remove-lat-long">Remove lat, long</h2>

<div class="language-r highlighter-rouge"><div class="highlight"><pre class="highlight"><code><span class="n">all_trips</span><span class="w"> </span><span class="o">&lt;-</span><span class="w"> </span><span class="n">all_trips</span><span class="w"> </span><span class="o">%&gt;%</span><span class="w">
  </span><span class="n">select</span><span class="p">(</span><span class="o">-</span><span class="nf">c</span><span class="p">(</span><span class="n">start_lat</span><span class="p">,</span><span class="w"> </span><span class="n">start_lng</span><span class="p">,</span><span class="w"> </span><span class="n">end_lat</span><span class="p">,</span><span class="w"> </span><span class="n">end_lng</span><span class="p">,</span><span class="w"> </span><span class="n">tripduration</span><span class="p">))</span><span class="w">
</span></code></pre></div></div>

<h2 id="load-all_trips-and-preview">Load ‘all_trips’ and Preview</h2>

<div class="language-r highlighter-rouge"><div class="highlight"><pre class="highlight"><code><span class="c1">#colnames(all_trips)</span><span class="w">
</span><span class="c1">#nrow(all_trips)</span><span class="w">
</span><span class="c1">#dim(all_trips)</span><span class="w">
</span><span class="c1">#head(all_trips)</span><span class="w">
</span><span class="c1">#str(all_trips)</span><span class="w">
</span><span class="n">summary</span><span class="p">(</span><span class="n">all_trips</span><span class="p">)</span><span class="w"> </span><span class="c1">#only one line needed</span><span class="w">
</span></code></pre></div></div>

<h2 id="clean-member_casual-column-for-consistency">Clean ‘member_casual’ Column for Consistency</h2>

<div class="language-r highlighter-rouge"><div class="highlight"><pre class="highlight"><code><span class="c1">#table(all_trips$member_casual) #view table for memberships</span><span class="w">
</span><span class="n">all_trips</span><span class="w"> </span><span class="o">&lt;-</span><span class="w"> </span><span class="n">all_trips</span><span class="w"> </span><span class="o">%&gt;%</span><span class="w">
  </span><span class="n">mutate</span><span class="p">(</span><span class="n">member_casual</span><span class="w"> </span><span class="o">=</span><span class="w"> </span><span class="n">recode</span><span class="p">(</span><span class="n">member_casual</span><span class="w"> </span><span class="p">,</span><span class="s2">"Subscriber"</span><span class="w"> </span><span class="o">=</span><span class="w"> </span><span class="s2">"member"</span><span class="w"> </span><span class="p">,</span><span class="s2">"Customer"</span><span class="w"> </span><span class="o">=</span><span class="w"> </span><span class="s2">"casual"</span><span class="p">))</span><span class="w">
</span><span class="n">table</span><span class="p">(</span><span class="n">all_trips</span><span class="o">$</span><span class="n">member_casual</span><span class="p">)</span><span class="w"> </span><span class="c1">#verify table update contains 2 variables</span><span class="w">
</span></code></pre></div></div>

<h2 id="split-date-into-columns-for-better-aggregation">Split Date into Columns for Better Aggregation</h2>
<div class="language-r highlighter-rouge"><div class="highlight"><pre class="highlight"><code><span class="n">all_trips</span><span class="o">$</span><span class="n">date</span><span class="w"> </span><span class="o">&lt;-</span><span class="w"> </span><span class="n">as.Date</span><span class="p">(</span><span class="n">all_trips</span><span class="o">$</span><span class="n">started_at</span><span class="p">)</span><span class="w"> </span><span class="c1">#The default format is yyyy-mm-dd</span><span class="w">
</span><span class="n">all_trips</span><span class="o">$</span><span class="n">month</span><span class="w"> </span><span class="o">&lt;-</span><span class="w"> </span><span class="n">format</span><span class="p">(</span><span class="n">as.Date</span><span class="p">(</span><span class="n">all_trips</span><span class="o">$</span><span class="n">date</span><span class="p">),</span><span class="w"> </span><span class="s2">"%m"</span><span class="p">)</span><span class="w">
</span><span class="n">all_trips</span><span class="o">$</span><span class="n">day</span><span class="w"> </span><span class="o">&lt;-</span><span class="w"> </span><span class="n">format</span><span class="p">(</span><span class="n">as.Date</span><span class="p">(</span><span class="n">all_trips</span><span class="o">$</span><span class="n">date</span><span class="p">),</span><span class="w"> </span><span class="s2">"%d"</span><span class="p">)</span><span class="w">
</span><span class="n">all_trips</span><span class="o">$</span><span class="n">year</span><span class="w"> </span><span class="o">&lt;-</span><span class="w"> </span><span class="n">format</span><span class="p">(</span><span class="n">as.Date</span><span class="p">(</span><span class="n">all_trips</span><span class="o">$</span><span class="n">date</span><span class="p">),</span><span class="w"> </span><span class="s2">"%Y"</span><span class="p">)</span><span class="w">
</span><span class="n">all_trips</span><span class="o">$</span><span class="n">day_of_week</span><span class="w"> </span><span class="o">&lt;-</span><span class="w"> </span><span class="n">format</span><span class="p">(</span><span class="n">as.Date</span><span class="p">(</span><span class="n">all_trips</span><span class="o">$</span><span class="n">date</span><span class="p">),</span><span class="w"> </span><span class="s2">"%A"</span><span class="p">)</span><span class="w">
</span></code></pre></div></div>

<h2 id="add-ride_length-calculation-and-make-numeric">Add ‘ride_length’ Calculation and Make Numeric</h2>
<div class="language-r highlighter-rouge"><div class="highlight"><pre class="highlight"><code><span class="n">all_trips</span><span class="o">$</span><span class="n">ride_length</span><span class="w"> </span><span class="o">&lt;-</span><span class="w"> </span><span class="n">difftime</span><span class="p">(</span><span class="n">all_trips</span><span class="o">$</span><span class="n">ended_at</span><span class="p">,</span><span class="n">all_trips</span><span class="o">$</span><span class="n">started_at</span><span class="p">)</span><span class="w">
</span><span class="c1">#is.factor(all_trips$ride_length)</span><span class="w">
</span><span class="n">all_trips</span><span class="o">$</span><span class="n">ride_length</span><span class="w"> </span><span class="o">&lt;-</span><span class="w"> </span><span class="nf">as.numeric</span><span class="p">(</span><span class="nf">as.character</span><span class="p">(</span><span class="n">all_trips</span><span class="o">$</span><span class="n">ride_length</span><span class="p">))</span><span class="w">
</span><span class="nf">is.numeric</span><span class="p">(</span><span class="n">all_trips</span><span class="o">$</span><span class="n">ride_length</span><span class="p">)</span><span class="w"> </span><span class="c1">#verify numeric</span><span class="w">
</span></code></pre></div></div>

<h2 id="remove-the-rows-of-bad-data">Remove the Rows of Bad Data</h2>

<p>data frame include a few hundred entries when bikes were removed for service</p>

<div class="language-r highlighter-rouge"><div class="highlight"><pre class="highlight"><code><span class="n">all_trips_v2</span><span class="w"> </span><span class="o">&lt;-</span><span class="w"> </span><span class="n">all_trips</span><span class="p">[</span><span class="o">!</span><span class="p">(</span><span class="n">all_trips</span><span class="o">$</span><span class="n">start_station_name</span><span class="w"> </span><span class="o">==</span><span class="w"> </span><span class="s2">"HQ QR"</span><span class="w"> </span><span class="o">|</span><span class="w"> </span><span class="n">all_trips</span><span class="o">$</span><span class="n">ride_length</span><span class="o">&lt;</span><span class="m">0</span><span class="p">),]</span><span class="w">
</span></code></pre></div></div>

<h1 id="prepare-descriptive-analysis">Prepare Descriptive Analysis</h1>
<h2 id="analyze-ride-lengths">Analyze Ride Lengths</h2>

<div class="language-r highlighter-rouge"><div class="highlight"><pre class="highlight"><code><span class="c1">#calculate all ride lengths</span><span class="w">
</span><span class="c1">#mean(all_trips_v2$ride_length) #average (total ride length / rides)</span><span class="w">
</span><span class="c1">#median(all_trips_v2$ride_length) #midpoint ride length</span><span class="w">
</span><span class="c1">#max(all_trips_v2$ride_length) #longest ride</span><span class="w">
</span><span class="c1">#min(all_trips_v2$ride_length) #shortest ride</span><span class="w">
</span><span class="c1"># or more simply on one line</span><span class="w">
</span><span class="n">summary</span><span class="p">(</span><span class="n">all_trips_v2</span><span class="o">$</span><span class="n">ride_length</span><span class="p">)</span><span class="w">
</span></code></pre></div></div>

<h2 id="compare-casual-and-members">Compare Casual and Members</h2>

<div class="language-r highlighter-rouge"><div class="highlight"><pre class="highlight"><code><span class="n">aggregate</span><span class="p">(</span><span class="n">all_trips_v2</span><span class="o">$</span><span class="n">ride_length</span><span class="w"> </span><span class="o">~</span><span class="w"> </span><span class="n">all_trips_v2</span><span class="o">$</span><span class="n">member_casual</span><span class="p">,</span><span class="w"> </span><span class="n">FUN</span><span class="w"> </span><span class="o">=</span><span class="w"> </span><span class="n">mean</span><span class="p">)</span><span class="w">
</span><span class="n">aggregate</span><span class="p">(</span><span class="n">all_trips_v2</span><span class="o">$</span><span class="n">ride_length</span><span class="w"> </span><span class="o">~</span><span class="w"> </span><span class="n">all_trips_v2</span><span class="o">$</span><span class="n">member_casual</span><span class="p">,</span><span class="w"> </span><span class="n">FUN</span><span class="w"> </span><span class="o">=</span><span class="w"> </span><span class="n">median</span><span class="p">)</span><span class="w">
</span><span class="n">aggregate</span><span class="p">(</span><span class="n">all_trips_v2</span><span class="o">$</span><span class="n">ride_length</span><span class="w"> </span><span class="o">~</span><span class="w"> </span><span class="n">all_trips_v2</span><span class="o">$</span><span class="n">member_casual</span><span class="p">,</span><span class="w"> </span><span class="n">FUN</span><span class="w"> </span><span class="o">=</span><span class="w"> </span><span class="n">max</span><span class="p">)</span><span class="w">
</span><span class="n">aggregate</span><span class="p">(</span><span class="n">all_trips_v2</span><span class="o">$</span><span class="n">ride_length</span><span class="w"> </span><span class="o">~</span><span class="w"> </span><span class="n">all_trips_v2</span><span class="o">$</span><span class="n">member_casual</span><span class="p">,</span><span class="w"> </span><span class="n">FUN</span><span class="w"> </span><span class="o">=</span><span class="w"> </span><span class="n">min</span><span class="p">)</span><span class="w">
</span></code></pre></div></div>

<h2 id="correct-day-of-week-order">Correct Day of Week Order</h2>

<div class="language-r highlighter-rouge"><div class="highlight"><pre class="highlight"><code><span class="n">all_trips_v2</span><span class="o">$</span><span class="n">day_of_week</span><span class="w"> </span><span class="o">&lt;-</span><span class="w"> </span><span class="n">ordered</span><span class="p">(</span><span class="n">all_trips_v2</span><span class="o">$</span><span class="n">day_of_week</span><span class="p">,</span><span class="w"> </span><span class="n">levels</span><span class="o">=</span><span class="nf">c</span><span class="p">(</span><span class="s2">"Sunday"</span><span class="p">,</span><span class="w"> </span><span class="s2">"Monday"</span><span class="p">,</span><span class="w"> </span><span class="s2">"Tuesday"</span><span class="p">,</span><span class="w"> </span><span class="s2">"Wednesday"</span><span class="p">,</span><span class="w"> </span><span class="s2">"Thursday"</span><span class="p">,</span><span class="w"> </span><span class="s2">"Friday"</span><span class="p">,</span><span class="w"> </span><span class="s2">"Saturday"</span><span class="p">))</span><span class="w">
</span><span class="n">aggregate</span><span class="p">(</span><span class="n">all_trips_v2</span><span class="o">$</span><span class="n">ride_length</span><span class="w"> </span><span class="o">~</span><span class="w"> </span><span class="n">all_trips_v2</span><span class="o">$</span><span class="n">member_casual</span><span class="w"> </span><span class="o">+</span><span class="w"> </span><span class="n">all_trips_v2</span><span class="o">$</span><span class="n">day_of_week</span><span class="p">,</span><span class="w"> </span><span class="n">FUN</span><span class="w"> </span><span class="o">=</span><span class="n">mean</span><span class="p">)</span><span class="w">
</span></code></pre></div></div>

<h1 id="analyze-data-by-type-and-weekday">Analyze Data by Type and Weekday</h1>

<div class="language-r highlighter-rouge"><div class="highlight"><pre class="highlight"><code><span class="n">all_trips_v2</span><span class="w"> </span><span class="o">%&gt;%</span><span class="w">
  </span><span class="n">mutate</span><span class="p">(</span><span class="n">weekday</span><span class="w"> </span><span class="o">=</span><span class="w"> </span><span class="n">wday</span><span class="p">(</span><span class="n">started_at</span><span class="p">,</span><span class="w"> </span><span class="n">label</span><span class="w"> </span><span class="o">=</span><span class="w"> </span><span class="kc">TRUE</span><span class="p">))</span><span class="w"> </span><span class="o">%&gt;%</span><span class="w"> </span><span class="c1">#creates weekday field using wday</span><span class="w">
    </span><span class="n">group_by</span><span class="p">(</span><span class="n">member_casual</span><span class="p">,</span><span class="w"> </span><span class="n">weekday</span><span class="p">)</span><span class="w"> </span><span class="o">%&gt;%</span><span class="w"> </span><span class="c1">#groups by usertype and weekday</span><span class="w">
      </span><span class="n">summarise</span><span class="p">(</span><span class="n">number_of_rides</span><span class="w"> </span><span class="o">=</span><span class="w"> </span><span class="n">n</span><span class="p">(),</span><span class="w"> </span><span class="n">average_duration</span><span class="w"> </span><span class="o">=</span><span class="w"> </span><span class="n">mean</span><span class="p">(</span><span class="n">ride_length</span><span class="p">))</span><span class="w"> </span><span class="o">%&gt;%</span><span class="w">
        </span><span class="n">arrange</span><span class="p">(</span><span class="n">member_casual</span><span class="p">,</span><span class="w"> </span><span class="n">weekday</span><span class="p">)</span><span class="w">
</span></code></pre></div></div>

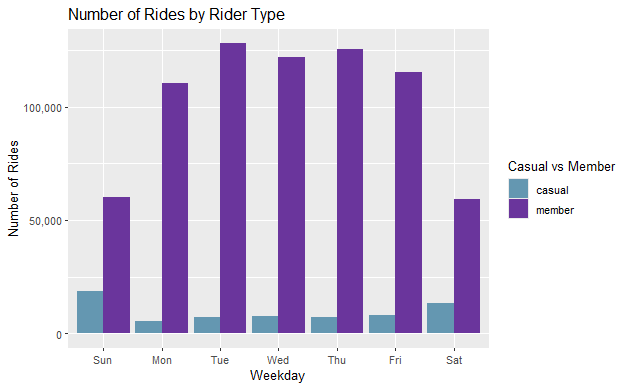
<h2 id="visualize-number-of-rides-by-rider-type">Visualize Number of Rides by Rider Type</h2>

<div class="language-r highlighter-rouge"><div class="highlight"><pre class="highlight"><code><span class="n">all_trips_v2</span><span class="w"> </span><span class="o">%&gt;%</span><span class="w">
  </span><span class="n">mutate</span><span class="p">(</span><span class="n">weekday</span><span class="w"> </span><span class="o">=</span><span class="w"> </span><span class="n">wday</span><span class="p">(</span><span class="n">started_at</span><span class="p">,</span><span class="w"> </span><span class="n">label</span><span class="w"> </span><span class="o">=</span><span class="w"> </span><span class="kc">TRUE</span><span class="p">))</span><span class="w"> </span><span class="o">%&gt;%</span><span class="w">
    </span><span class="n">group_by</span><span class="p">(</span><span class="n">member_casual</span><span class="p">,</span><span class="w"> </span><span class="n">weekday</span><span class="p">)</span><span class="w"> </span><span class="o">%&gt;%</span><span class="w">
      </span><span class="n">summarise</span><span class="p">(</span><span class="n">number_of_rides</span><span class="w"> </span><span class="o">=</span><span class="w"> </span><span class="n">n</span><span class="p">(),</span><span class="w"> </span><span class="n">average_duration</span><span class="w"> </span><span class="o">=</span><span class="w"> </span><span class="n">mean</span><span class="p">(</span><span class="n">ride_length</span><span class="p">))</span><span class="w"> </span><span class="o">%&gt;%</span><span class="w">
        </span><span class="n">arrange</span><span class="p">(</span><span class="n">member_casual</span><span class="p">,</span><span class="w"> </span><span class="n">weekday</span><span class="p">)</span><span class="w"> </span><span class="o">%&gt;%</span><span class="w">
          </span><span class="n">ggplot</span><span class="p">(</span><span class="n">aes</span><span class="p">(</span><span class="n">x</span><span class="w"> </span><span class="o">=</span><span class="w"> </span><span class="n">weekday</span><span class="p">,</span><span class="w"> </span><span class="n">y</span><span class="w"> </span><span class="o">=</span><span class="w"> </span><span class="n">number_of_rides</span><span class="p">,</span><span class="w"> </span><span class="n">fill</span><span class="w"> </span><span class="o">=</span><span class="w"> </span><span class="n">member_casual</span><span class="p">))</span><span class="w"> </span><span class="o">+</span><span class="w">
          </span><span class="n">geom_col</span><span class="p">(</span><span class="n">position</span><span class="w"> </span><span class="o">=</span><span class="w"> </span><span class="s2">"dodge"</span><span class="p">)</span><span class="w"> </span><span class="o">+</span><span class="w">
          </span><span class="n">scale_x_discrete</span><span class="p">(</span><span class="n">name</span><span class="o">=</span><span class="s2">"Weekday"</span><span class="p">)</span><span class="w"> </span><span class="o">+</span><span class="w">
          </span><span class="n">scale_y_continuous</span><span class="p">(</span><span class="n">labels</span><span class="o">=</span><span class="n">comma</span><span class="p">,</span><span class="w"> </span><span class="n">name</span><span class="o">=</span><span class="s2">"Number of Rides"</span><span class="p">)</span><span class="w"> </span><span class="o">+</span><span class="w">
          </span><span class="n">labs</span><span class="p">(</span><span class="n">title</span><span class="w"> </span><span class="o">=</span><span class="w"> </span><span class="s2">"Number of Rides by Rider Type"</span><span class="p">,</span><span class="w"> </span><span class="n">fill</span><span class="o">=</span><span class="w"> </span><span class="s2">"Casual vs Member"</span><span class="p">)</span><span class="w"> </span><span class="o">+</span><span class="w">
          </span><span class="n">scale_fill_paletteer_d</span><span class="p">(</span><span class="s2">"PrettyCols::Bold"</span><span class="p">)</span><span class="w">
</span></code></pre></div></div>
<p><img src="/assets/images/numridebytype.png" alt="numrider" /></p>

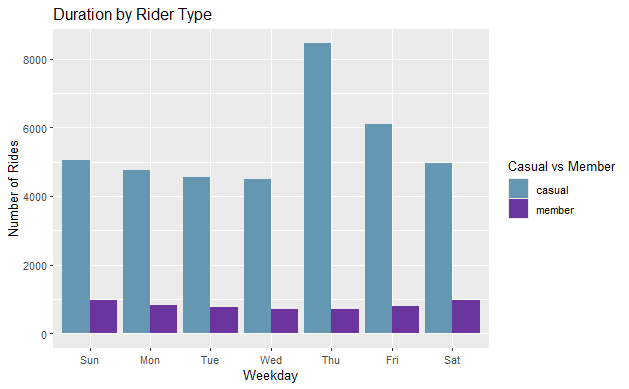
<h2 id="visualize-average-duration-by-rider-type">Visualize Average Duration by Rider Type</h2>

<div class="language-r highlighter-rouge"><div class="highlight"><pre class="highlight"><code><span class="n">all_trips_v2</span><span class="w"> </span><span class="o">%&gt;%</span><span class="w">
  </span><span class="n">mutate</span><span class="p">(</span><span class="n">weekday</span><span class="w"> </span><span class="o">=</span><span class="w"> </span><span class="n">wday</span><span class="p">(</span><span class="n">started_at</span><span class="p">,</span><span class="w"> </span><span class="n">label</span><span class="w"> </span><span class="o">=</span><span class="w"> </span><span class="kc">TRUE</span><span class="p">))</span><span class="w"> </span><span class="o">%&gt;%</span><span class="w">
    </span><span class="n">group_by</span><span class="p">(</span><span class="n">member_casual</span><span class="p">,</span><span class="w"> </span><span class="n">weekday</span><span class="p">)</span><span class="w"> </span><span class="o">%&gt;%</span><span class="w">
      </span><span class="n">summarise</span><span class="p">(</span><span class="n">number_of_rides</span><span class="w"> </span><span class="o">=</span><span class="w"> </span><span class="n">n</span><span class="p">(),</span><span class="w"> </span><span class="n">average_duration</span><span class="w"> </span><span class="o">=</span><span class="w"> </span><span class="n">mean</span><span class="p">(</span><span class="n">ride_length</span><span class="p">))</span><span class="w"> </span><span class="o">%&gt;%</span><span class="w">
        </span><span class="n">arrange</span><span class="p">(</span><span class="n">member_casual</span><span class="p">,</span><span class="w"> </span><span class="n">weekday</span><span class="p">)</span><span class="w"> </span><span class="o">%&gt;%</span><span class="w">
          </span><span class="n">ggplot</span><span class="p">(</span><span class="n">aes</span><span class="p">(</span><span class="n">x</span><span class="w"> </span><span class="o">=</span><span class="w"> </span><span class="n">weekday</span><span class="p">,</span><span class="w"> </span><span class="n">y</span><span class="w"> </span><span class="o">=</span><span class="w"> </span><span class="n">average_duration</span><span class="p">,</span><span class="w"> </span><span class="n">fill</span><span class="w"> </span><span class="o">=</span><span class="w"> </span><span class="n">member_casual</span><span class="p">))</span><span class="w"> </span><span class="o">+</span><span class="w">
          </span><span class="n">geom_col</span><span class="p">(</span><span class="n">position</span><span class="w"> </span><span class="o">=</span><span class="w"> </span><span class="s2">"dodge"</span><span class="p">)</span><span class="w"> </span><span class="o">+</span><span class="w">
          </span><span class="n">scale_x_discrete</span><span class="p">(</span><span class="n">name</span><span class="o">=</span><span class="s2">"Weekday"</span><span class="p">)</span><span class="w"> </span><span class="o">+</span><span class="w">
          </span><span class="n">scale_y_continuous</span><span class="p">(</span><span class="n">name</span><span class="o">=</span><span class="s2">"Number of Rides"</span><span class="p">)</span><span class="w"> </span><span class="o">+</span><span class="w">
          </span><span class="n">labs</span><span class="p">(</span><span class="n">title</span><span class="w"> </span><span class="o">=</span><span class="w"> </span><span class="s2">"Duration by Rider Type"</span><span class="p">,</span><span class="w"> </span><span class="n">fill</span><span class="o">=</span><span class="w"> </span><span class="s2">"Casual vs Member"</span><span class="p">)</span><span class="w"> </span><span class="o">+</span><span class="w">
          </span><span class="n">scale_fill_paletteer_d</span><span class="p">(</span><span class="s2">"PrettyCols::Bold"</span><span class="p">)</span><span class="w">
</span></code></pre></div></div>
<p><img src="/assets/images/durridebytype.png" alt="numrider" /></p>

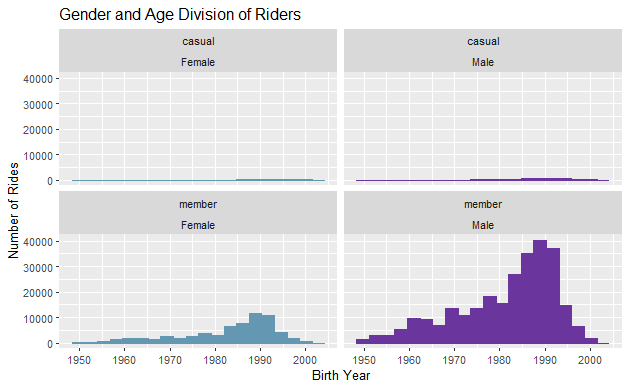
<h2 id="visualise-gender-and-age-division-of-riders">Visualise Gender and Age Division of Riders</h2>

<div class="language-r highlighter-rouge"><div class="highlight"><pre class="highlight"><code><span class="n">all_trips_v2</span><span class="w"> </span><span class="o">%&gt;%</span><span class="w">
  </span><span class="n">filter</span><span class="p">(</span><span class="o">!</span><span class="nf">is.na</span><span class="p">(</span><span class="n">gender</span><span class="p">))</span><span class="w"> </span><span class="o">%&gt;%</span><span class="w">
  </span><span class="n">filter</span><span class="p">(</span><span class="n">birthyear</span><span class="w"> </span><span class="o">&gt;=</span><span class="w"> </span><span class="m">1950L</span><span class="w"> </span><span class="o">&amp;</span><span class="w"> </span><span class="n">birthyear</span><span class="w"> </span><span class="o">&lt;=</span><span class="w"> </span><span class="m">2003L</span><span class="w"> </span><span class="o">&amp;</span><span class="w"> </span><span class="o">!</span><span class="nf">is.na</span><span class="p">(</span><span class="n">birthyear</span><span class="p">))</span><span class="w"> </span><span class="o">%&gt;%</span><span class="w">
  </span><span class="n">ggplot</span><span class="p">()</span><span class="w"> </span><span class="o">+</span><span class="w">
  </span><span class="n">aes</span><span class="p">(</span><span class="n">x</span><span class="w"> </span><span class="o">=</span><span class="w"> </span><span class="n">birthyear</span><span class="p">,</span><span class="w"> </span><span class="n">color</span><span class="w"> </span><span class="o">=</span><span class="w"> </span><span class="n">gender</span><span class="p">,</span><span class="w"> </span><span class="n">fill</span><span class="w"> </span><span class="o">=</span><span class="w"> </span><span class="n">gender</span><span class="p">)</span><span class="w"> </span><span class="o">+</span><span class="w">
  </span><span class="n">geom_histogram</span><span class="p">(</span><span class="n">bins</span><span class="w"> </span><span class="o">=</span><span class="w"> </span><span class="m">20L</span><span class="p">,</span><span class="w"> </span><span class="n">show.legend</span><span class="w"> </span><span class="o">=</span><span class="w"> </span><span class="kc">FALSE</span><span class="p">)</span><span class="w"> </span><span class="o">+</span><span class="w">
  </span><span class="n">facet_wrap</span><span class="p">(</span><span class="n">vars</span><span class="p">(</span><span class="n">member_casual</span><span class="p">,</span><span class="w"> </span><span class="n">gender</span><span class="p">))</span><span class="w"> </span><span class="o">+</span><span class="w">
  </span><span class="n">scale_x_continuous</span><span class="p">(</span><span class="n">name</span><span class="o">=</span><span class="s2">"Birth Year"</span><span class="p">)</span><span class="w"> </span><span class="o">+</span><span class="w">
  </span><span class="n">scale_y_continuous</span><span class="p">(</span><span class="n">name</span><span class="o">=</span><span class="s2">"Number of Rides"</span><span class="p">)</span><span class="w"> </span><span class="o">+</span><span class="w">
  </span><span class="n">labs</span><span class="p">(</span><span class="n">title</span><span class="w"> </span><span class="o">=</span><span class="w"> </span><span class="s2">"Gender and Age Division of Riders"</span><span class="p">)</span><span class="w"> </span><span class="o">+</span><span class="w">
  </span><span class="n">scale_fill_paletteer_d</span><span class="p">(</span><span class="s2">"PrettyCols::Bold"</span><span class="p">)</span><span class="w"> </span><span class="o">+</span><span class="w">
  </span><span class="n">scale_color_paletteer_d</span><span class="p">(</span><span class="s2">"PrettyCols::Bold"</span><span class="p">)</span><span class="w">
</span></code></pre></div></div>
<p><img src="/assets/images/riderdivision.png" alt="numrider" /></p>

<h1 id="export-summary-file-for-further-analysis">Export Summary File for Further Analysis</h1>

<div class="language-r highlighter-rouge"><div class="highlight"><pre class="highlight"><code><span class="n">counts</span><span class="w"> </span><span class="o">&lt;-</span><span class="w"> </span><span class="n">aggregate</span><span class="p">(</span><span class="n">all_trips_v2</span><span class="o">$</span><span class="n">ride_length</span><span class="w"> </span><span class="o">~</span><span class="w"> </span><span class="n">all_trips_v2</span><span class="o">$</span><span class="n">member_casual</span><span class="w"> </span><span class="o">+</span><span class="w">
                      </span><span class="n">all_trips_v2</span><span class="o">$</span><span class="n">day_of_week</span><span class="p">,</span><span class="w"> </span><span class="n">FUN</span><span class="w"> </span><span class="o">=</span><span class="w"> </span><span class="n">mean</span><span class="p">,)</span><span class="w">
</span><span class="n">write.csv</span><span class="p">(</span><span class="n">counts</span><span class="p">,</span><span class="w"> </span><span class="n">file</span><span class="w"> </span><span class="o">=</span><span class="w"> </span><span class="s1">'output_CSV/avg_ride_length.csv'</span><span class="p">)</span><span class="w">
</span></code></pre></div></div>

<h1 id="observations">Observations</h1>

<ul>
  <li>Casual users have significantly longer rides on Sundays compared to members.<br /></li>
  <li>Casual users have much shorter rides on weekdays compared to members.<br /></li>
  <li>Casual users typically have longer ride lengths than members.<br /></li>
</ul>

<h1 id="recommendations">Recommendations</h1>

<ul>
  <li>Create weekend specific memberships plans, the “Weekend Warrior” plan.<br /></li>
  <li>Highlight benefits for daily commuters, the “Bike 2 Work” plan.<br /></li>
  <li>Implement a tiered membership to reward longer rides.<br /></li>
  <li>Create loyalty program with points, redeemed for merch from local partners.<br /></li>
</ul>

<h1 id="find-this-project-on-the-web">Find this Project on the Web!</h1>

<p><a href="https://www.kaggle.com/code/gregwhitmore/coursera-capstone-in-python-cyclistic-ridership">Kaggle Notebook in Python</a><br />
<a href="https://www.kaggle.com/code/gregwhitmore/coursera-capstone-in-r-cyclistic-ridership-study">Kaggle Notebook in R</a><br />
<a href="https://public.tableau.com/app/profile/greg.whitmore/viz/Cyclistic-Casual-vs-Member-Ridership/CyclisticDashboard">Tableau Dashboard</a></p>]]></content><author><name>Gregory Whitmore</name></author><category term="blog" /><category term="data" /><category term="visualization" /><category term="Tableau" /><category term="Python" /><category term="R" /><category term="Kaggle" /><summary type="html"><![CDATA[In today’s data-driven world, the ability to analyze and interpret data is crucial for making informed decisions. As part of the Data Analytics Certificate program, this capstone project focuses on the Cyclistic bike-sharing dataset, which provides a rich source of information on bike usage patterns in a major metropolitan area. By leveraging this dataset, I aim to uncover insights into user behavior, identify trends, and provide actionable recommendations to enhance the bike-sharing experience. This project not only demonstrates the practical application of data analytics skills but also contributes to the growing field of sustainable urban transportation.]]></summary></entry></feed>